

April 07, 2020


Before the COVID-19 pandemic, more than 30 million US workers were employed in six broad industries that are now on the frontlines of the response. They include grocery store clerks, nurses, cleaners, warehouse workers, and bus drivers, among others. They were essential before the pandemic hit, yet also overworked, underpaid, under protected, and under appreciated. The tables below provide a basic demographic profile of workers in these frontline industries.
Table 1 shows the number of workers in six groups of frontline industries and the characteristics of the workforce in each of these industry groups. An accompanying spreadsheet provides state-level versions of Table 1. Additionally, New York state data are used in this report by the Fiscal Policy Institute.
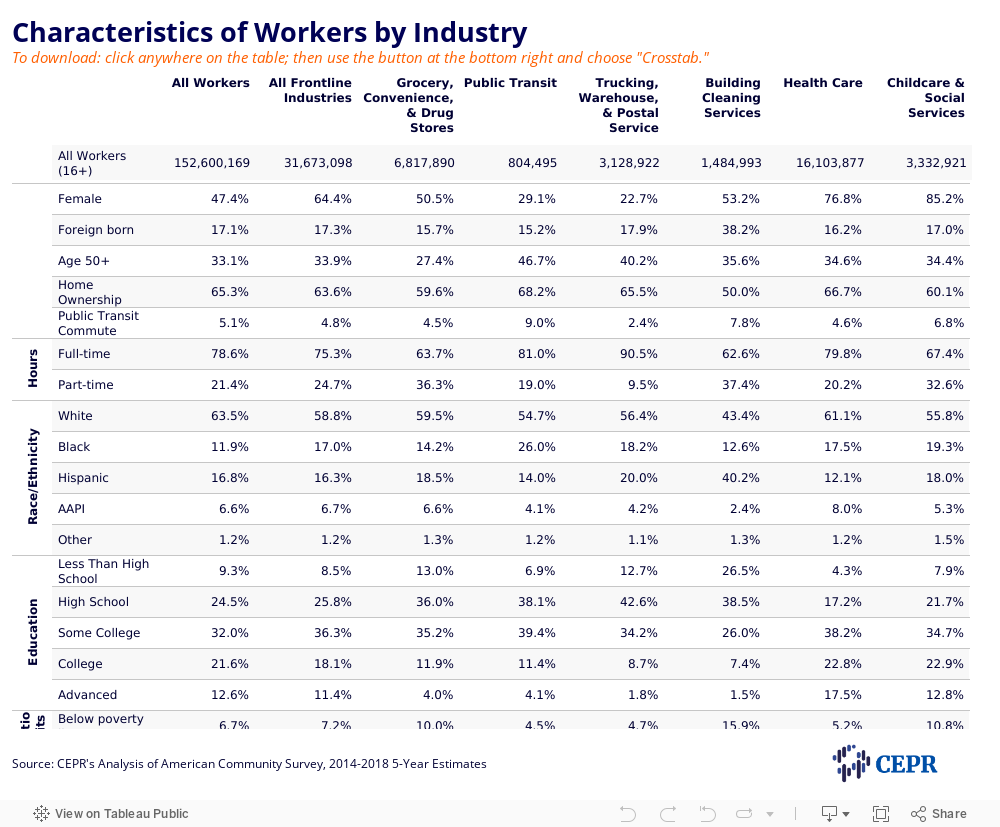
Table 2 lists the specific industries within each of the six industry groups and shows the percentage of women workers, workers of color, and low-income workers in each of these industries.
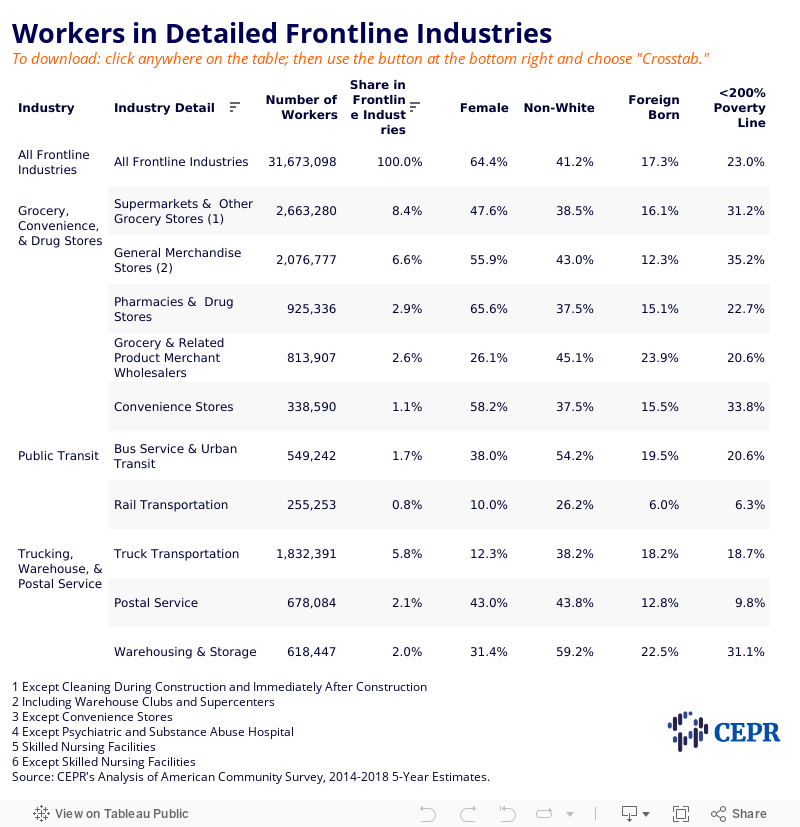
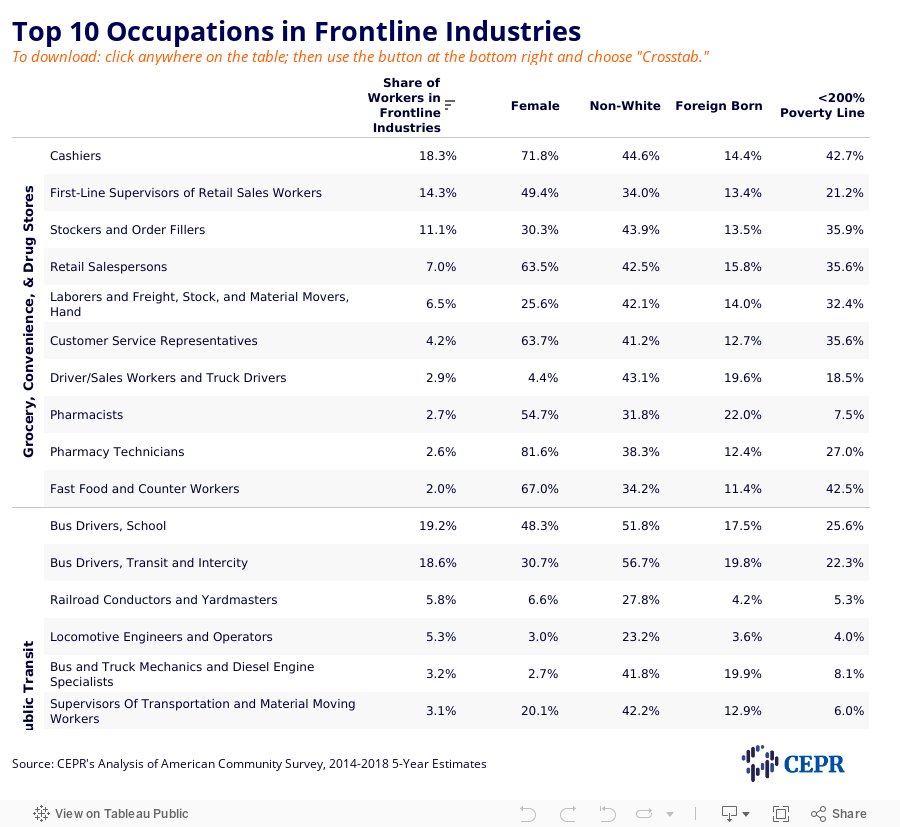
Table 3 lists the top 10 occupations in each of the frontline industries and shows the percentage of women workers, workers of color, and low-income workers in each of these occupations.
At the national level, notable findings include:
- Workers in frontline industries are disproportionately women. About one-half of all workers are women, but nearly two-thirds (64.4 percent) of frontline workers are women. Women are particularly overrepresented in the frontline industries of Health Care (76.8 percent of workers) and Child Care and Social Services (85.2 percent). Women are also overrepresented in the following occupations within frontline industries: cashiers (71.8 percent); retail salespersons (63.5 percent); customer service representatives (63.7 percent); pharmacy technicians (81.6 percent); fast food and counter workers (67 percent); all of the top 10 occupations in the Health Care industry group (71.3 to 96.5 percent), except physicians; and, all of the top 10 occupations in the Child Care and Social Services industry group (73.1 to 97.7 percent).
- People of color are overrepresented in many occupations within frontline industries. Just over four-in-ten (41.2 percent) frontline workers are Black, Hispanic, Asian-American/Pacific Islander, or some category other than white. Hispanics are especially overrepresented in Building Cleaning Services (40.2 percent of workers). Blacks are most overrepresented in Child Care and Social Services (19.3 percent of workers). Workers of color are particularly overrepresented in the following occupations: bus drivers, transit and intercity (56.7 percent); most of the top 10 occupations in Trucking, Warehouse, and Postal Service; most of the top 10 occupations in Building Cleaning Services; all of the top 10 occupations in Health Care, except registered nurses, physicians, managers, and secretaries and administrative; four of the top 10 occupations in Child Care and Social Services (childcare workers, personal care aides, social workers, and nursing assistants).
- Immigrants are overrepresented in Building Cleaning Services and in many frontline occupations in other frontline industries. About one-in-six frontline workers (17.3 percent) are immigrants. In Building Cleaning Services, 38.2 percent of workers are immigrants. Immigrant workers are also overrepresented in Grocery and Related Product Merchant Wholesalers (23.9 percent); Warehousing and Storage (22.5 percent), and Home Health Care Services (23.9 percent). Immigrants are particularly overrepresented in the following occupations: janitors and building cleaners (40.7 percent); maids and housekeeping cleaners (58.8 percent); cleaners of vehicles and equipment (34.5 percent); packers and packagers (39.1 percent); physicians (28.4 percent); and, home health aids (26.9 percent). A large share of personal care aids and nursing assistants in both the Health Care industry group and the Child Care and Social Services industry group are also immigrant workers (22.6 to 37.9 percent).
- Many workers in frontline industries are over age 50, and a substantial number live in a household with one or more older people. Just over one-in-three (33.9 percent) frontline workers are over age 50. Among all frontline workers, about one-in-six (16 percent) live with someone who is (or are themselves) over age 65.
- Many workers in frontline industries have family care obligations. More than one-third of frontline workers (35.9 percent) have a minor child at home.
- More than one-third of workers in many frontline industries live in low-income families. Roughly a third or more of low-income workers are found in six of the top 10 occupations in the Grocery, Convenience, and Drug Stores industry group; three of the top 10 occupations in the Trucking, Warehouse, and Postal Service industry group; four of the top 10 occupations in Building Cleaning Services industry group; three of the top ten occupations in the Health Care industry group; and, five of the top 10 occupations in the Child Care and Social Services industry group. Overall, almost one-quarter of frontline workers (23 percent) live in low-income families (income below 200 percent of poverty).
- The Building Cleaning Services industry has a particularly high incidence of uninsured workers. About one-in-ten frontline workers in this industry do not have health insurance. Among workers in Building Cleaning Services, nearly three-in-ten are uninsured.
While the COVID-19 legislation passed by Congress to date includes some important protections for frontline workers, these workers remain under protected and under compensated. Congress must act quickly on a variety of fronts to ensure that all frontline workers have: 1) comprehensive health insurance that includes free coverage of COVID-19 testing and treatment; 2) paid sick leave and paid family leave; 3) free child care; 4) student loan relief; and, 5) consumer and labor protections, including hazard pay or additional compensation. Frontline workers who are immigrants should be protected regardless of their current immigrant status. Finally, the US Occupational Safety and Health Administration should immediately issue an Emergency Temporary Standard requiring all employers to provide specific and necessary protections for frontline workers.
Methodology
This profile uses the most recent five-year estimates of data from the American Community Survey (2014–2018). The demographics of the frontline workforce is unlikely to have changed in any substantial way over the last two years, and using five-year estimates of ACS data helps ensure that sample sizes are sufficient to produce reasonably precise estimates by industry at the state level.
To define “frontline industries,” we use the same six industry groupings as the New York City Comptroller did in their recent profile of frontline workers in New York City. The frontline industry groups, each of which includes one or more specific industries (as classified using the Census Bureau’s Industry Codes), are:
- Grocery, Convenience, and Drug Stores: Grocery and related product merchant wholesalers (4470), Supermarkets and other grocery stores (4971), Convenience Stores (4972), Pharmacies and drug stores (5070), and General merchandise stores, including warehouse clubs and supercenters (5391).
- Public Transit: Rail transportation (6080) and Bus service and urban transit (6180).
- Trucking, Warehouse, and Postal Service: Truck transportation (6170), Warehousing and storage (6390), and Postal Service (6370).
- Building Cleaning Services: Cleaning Services to Buildings and Dwellings (7690).
- Health Care: Offices of physicians (7970), Outpatient care centers (8090), Home health care services (8170), Other health care services (8180), General medical and surgical hospitals, and specialty hospitals (8191), Psychiatric and substance abuse hospitals (8192), Nursing care facilities (skilled nursing facilities) (8270), and Residential care facilities, except skilled nursing facilities (8290).
- Child Care and Social Services: Individual and family services (8370), Community food and housing, and emergency services (8380), and Child day care services (8470).
Our initial analysis includes all US workers in these six frontline industry categories, but no workers in frontline occupations that are outside of these six categories. As a result, our estimates exclude some workers in occupations (but not industries) that are clearly on the frontlines, while also including some workers who are not in frontline occupations, even though they are in frontline industries. For example, a police officer is a frontline occupation in a non-frontline industry, while a school bus driver is a non-frontline occupation (at least in areas where schools are closed) in a frontline industry (public transit). Still, the vast majority of workers in the six frontline industries are frontline workers.
The data and program files used to create these tables are also made available for public use. Please use appropriate citations.
Data: http://ceprdata.org/wp-content/acs/data/cepr_acs_1418_beta_frontline.dta.zip
Program files: https://github.com/ceprdata/frontline-workers

