
Child’s
Play?
The Bush Administration’s Misuse of Data
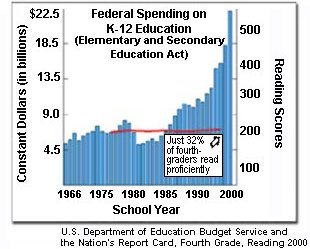
The Department of Education’s homepage prominently
features a graph that appears to show a vast increase in federal spending on
education over the last thirty five years, but no improvement whatsoever in
student test scores. (http://www.ed.gov)
(Figure 1). The message seems clear.

(Figure 1: http://www.ed.gov/images/title-one.jpg)
However, Figure 1 does not give an entirely accurate representation of the situation for several reasons. A better representation of the data might look like Figure 2 below.

There are several important differences between the two graphs.
Clearly, Figure 1 paints an incomplete picture of the relationship between school expenditures and student achievement. While it does seem to be that case that reading scores have not risen with school expenditures, math and science scores have risen. In these areas increased spending has been associated with improved student performance. From the standpoint of showing returns for increases spending, it is worth noting that private schools have not performed better. As seen in Figure 3 below, from 1970 to 2001 nonpublic school expenditures per K-12 student have grown at a 3.8% annual rate, compared to only 3.1% for public schools. However, the NAEP data from 1980 to 1999 indicates that average reading scores in nonpublic schools have not changed significantly, dropping one point over that time.[3]
Figure 2 actually understates the improvement in scores made by minorities. In 1999, 68 percent of nine-year old Hispanics scored at least 200 on the mathematics NAEP exam, compared to only 54 percent in 1978. For African-American students, the difference is even greater: the percent of students scoring at least 200 rose from 42 percent in 1978 up to 63 in 1999.[4]
Fortunately, all the necessary information is available to
the public. From enrollment and
expenditure data in the Statistical Abstract of the United States 2002 and test
score data available at the National Center for Education Statistics[5]
an informative graphic may be produced.

[1] David Rosnick is a Research Associate at the Center for Economic and Policy Research in Washington, D.C. (www.cepr.net)
[2] Figure 1 shows $13.8 billion in appropriations for 1999, but total K-12 expenditures that year amounted to $408.7 billion in constant 2000-01 dollars. The value for total expenditures was taken from the Statistical Abstract of the United States 2002.