

February 14, 2014

The air is thick these days with rhetoric about spending on means-tested programs. The reality, however, is that means-tested spending, outside of health care spending, just hasn’t increased much, if at all over the past several decades.
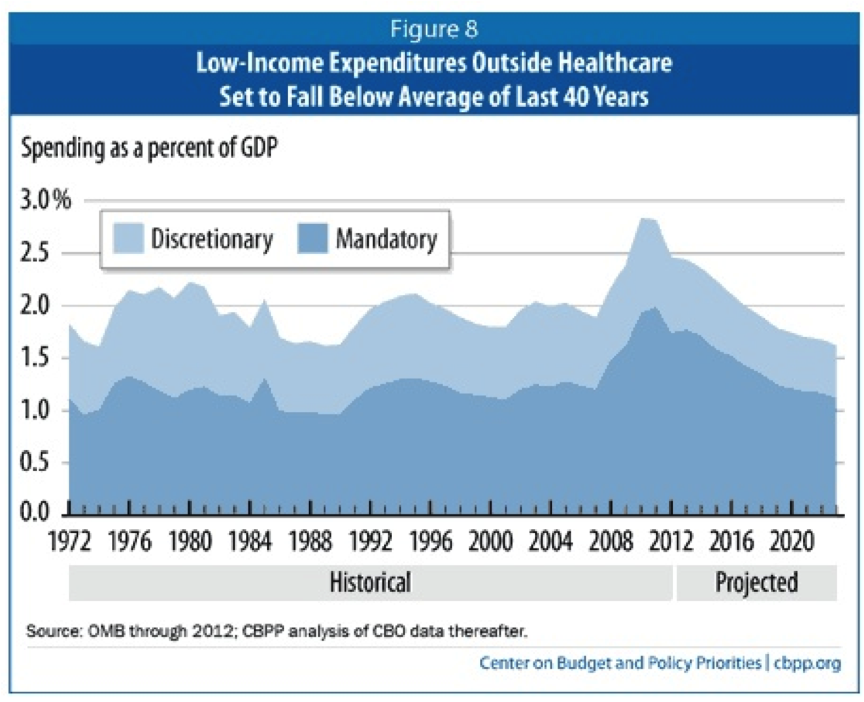
The CBPP chart below shows trends in spending on means-tested programs, other than health care, as a percent of GDP since 1972 and projected forward to 2023. The trend is pretty unremarkable. Spending on these programs has averaged about 2 percent of GDP. While spending peaked during the Great Recession, as one would expect and hope in a democracy that cares about the well-being of its people, it is now projected to fall back under 2 percent.
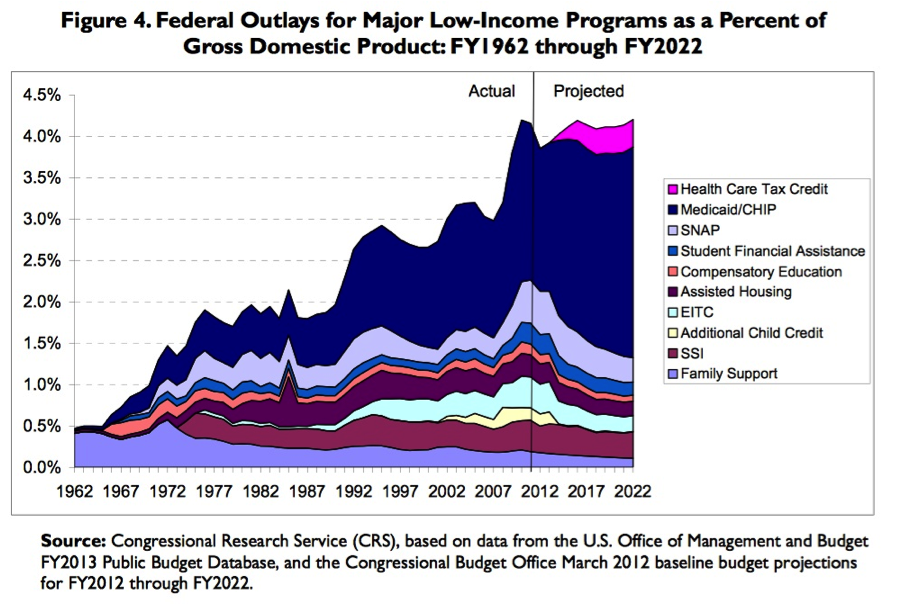
By contrast, means-tested spending on health care benefits (Medicaid/SCHIP) has increased substantially as a share of the economy over the several decades. The chart below, produced by researchers at the Congressional Research Service, shows the extent of this increase. Medicaid is the blue slice that expands somewhat in the 1970s and 1980s, and then substantially in subsequent years.
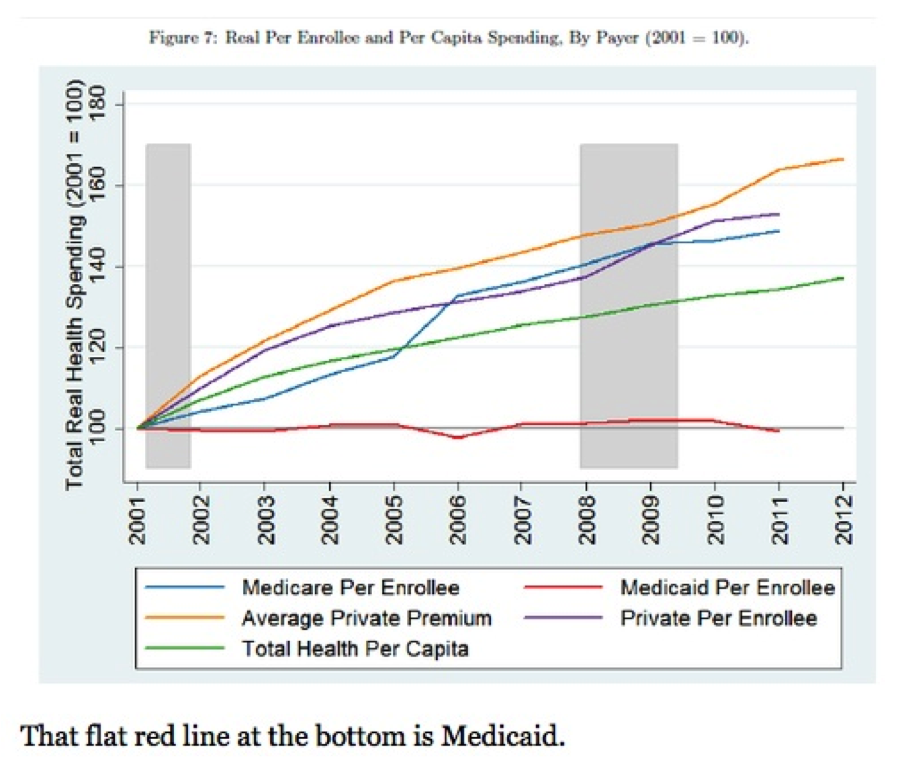
The increase in spending on Medicaid as a share of our nation’s economy is a very good thing for the most part. Health insurance and care are among the most fundamental of basic needs. Medicaid is a very efficient and effective way to meet these needs. And the increase in spending on Medicaid is mostly due to our growing resolve as a nation to meet these needs. Of course, some of the increase is due to increasing health care costs, but Medicaid has done a much better good job when it comes to controlling these costs than private insurance (and Medicare) as this CBO chart, via Paul Krugman, shows.
Some recent discussions of spending trends obscure these hard, cold facts. For example, in a recent blog post, Richard V. Reeves repeats his colleague Ron Haskins argument that “since 1980, spending [on means-tested programs] has tripled as measured on a per person in poverty basis in constant dollars.” [italics mine]
This is a misleading way to present spending trends, one that overhypes the actual increase—OMG, did u know spending on those welfare people tripled!—instead of providing useful information to the public.
The most basic problem is that the Reeves/Haskins denominator is limited to people below the official poverty line, while their numerator includes spending on many people low- and moderate-income above it. If Reeves/Haskins are trying to suggest here that all means-tested programs should be limited to the (extremely low and outdated) federal poverty line, they should come out and say that. Although if that is what they are trying to suggest, it is a not a good suggestion, especially if one is concerned about things like not penalizing work and marriage, ensuring kids in working-class families have health coverage, not forcing middle-class parents to institutionalize children with severe disabilities, and so on.
The inclusion of Medicaid in the Reeves/Haskins chart (and their failure to use a stacked line chart like CRS to allow readers to distinguish trends in Medicaid versus other means-tested programs) heightens its problematic nature. The vast majority of Medicaid spending is on seniors and people with disabilities, and more than a third of all spending is on long-term care services. As Bill Clinton argued in his 2012 Democratic convention speech (and many times before that) is important not just for people with incomes below the extremely low poverty line, it’s important for many working- and middle-class families, including as he put it: “kids from middle class families, with special needs like Downs syndrome or Autism.”

