


• Economic Crisis and RecoveryCrisis económica y recuperaciónPricesUnited StatesEE. UU.

On a lazy Friday afternoon, a person’s thoughts naturally turn to car price indexes. There is actually a reason that I became interested in this topic. I noticed that in the January Consumer Price Index, the new vehicle index rose 0.2 percent. The December measure was revised up due to new seasonal adjustment factors so that what had been reported as a 0.1 percent decline last month is now reported as a 0.6 percent increase.
I was inclined to think this was an aberration and that we would see the downward trend that had previously been apparent in the data reappear in another month or two. However, I noticed that the Manheim index for used vehicle prices showed a sharp uptick for January and the first half of February. This was after a full year in which declining prices were reversing much of the pandemic run-up. Perhaps my expectation that vehicle prices, both new and used, would soon look like they were back on their pre-pandemic path was wrong.
Vehicle prices are a big deal in the CPI. Together the new and used vehicle components comprise just under 7.0 percent of the overall index and 8.8 percent of the core index. As a result, it will have a big impact on our inflation measures if vehicle prices are on a downward path, as it seemed when we got the December CPI.
I thought I would look at a bit of history and pull in the index for imported vehicles. (This is not entirely apples to apples since the import index includes car parts.) Here’s the picture.
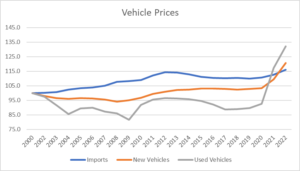
Source: Bureau of Labor Statistics.
As can be seen, the price index for imported vehicles somewhat outpaced the new vehicle index for the U.S. in the two decades prior to the pandemic. Currency values explain at least part of this movement. The dollar fell in value against the currencies of our trading partners from 2000 to 2012. It then began to rise modestly, which is the period when saw the gap close slightly. Still, by 2019 there was still a gap of roughly 7.0 percentage points, with the import price index rising by 9.8 percentage points since 2000, compared to an increase of just 2.8 percent in the new vehicle price index.
There was a larger gap between the new vehicle price index and the used vehicle price index. The used vehicle price index was actually 10.3 percent below its 2000 value in 2019, implying a gap of 13.1 percentage points between the new and used vehicle indexes over this 19-year period.
This story gets completely reversed in the years since the pandemic. Used vehicle prices are up by 37.2 percent, new vehicle prices are up by 20.1 percent, while the index for imported vehicles has increased by just 6.9 percent. This raises the question of whether there is some fundamental factor that has led to a lasting change in the pattern of new, used, and imported vehicles or whether this is a temporary story that will revert back to the pre-pandemic path in time.
Offhand, I can’t see any fundamental factor that has changed in a way that would affect these price trends. The dollar did rise in 2021 and earlier in 2022, which would lower imported car prices in the United States, but it is now pretty much back to its pre-pandemic level against most currencies, so currency valuations can’t explain much of the picture.
And, currency values won’t tell us anything about the far more rapid rise in used vehicle prices than new vehicle prices. This is easily explained in the context of pandemic shortages of cars, driving up used car prices, but if we envision a post-pandemic future where automakers can produce enough vehicles to meet demand, presumably, we will see the former pattern restored.
There may well be something that I am missing (suggestions welcome), but it still looks to me like we should expect the new vehicle index to converge towards the imported vehicle index and the used vehicle index to again drop below the new vehicle index. This path may take longer than I had expected, but it still seems likely.
That means that we should expect vehicle prices to be constraining inflation going forward. That may not be the case in the next couple of months, but it is likely to be true later in 2023 and into 2024.
On a lazy Friday afternoon, a person’s thoughts naturally turn to car price indexes. There is actually a reason that I became interested in this topic. I noticed that in the January Consumer Price Index, the new vehicle index rose 0.2 percent. The December measure was revised up due to new seasonal adjustment factors so that what had been reported as a 0.1 percent decline last month is now reported as a 0.6 percent increase.
I was inclined to think this was an aberration and that we would see the downward trend that had previously been apparent in the data reappear in another month or two. However, I noticed that the Manheim index for used vehicle prices showed a sharp uptick for January and the first half of February. This was after a full year in which declining prices were reversing much of the pandemic run-up. Perhaps my expectation that vehicle prices, both new and used, would soon look like they were back on their pre-pandemic path was wrong.
Vehicle prices are a big deal in the CPI. Together the new and used vehicle components comprise just under 7.0 percent of the overall index and 8.8 percent of the core index. As a result, it will have a big impact on our inflation measures if vehicle prices are on a downward path, as it seemed when we got the December CPI.
I thought I would look at a bit of history and pull in the index for imported vehicles. (This is not entirely apples to apples since the import index includes car parts.) Here’s the picture.
Source: Bureau of Labor Statistics.
As can be seen, the price index for imported vehicles somewhat outpaced the new vehicle index for the U.S. in the two decades prior to the pandemic. Currency values explain at least part of this movement. The dollar fell in value against the currencies of our trading partners from 2000 to 2012. It then began to rise modestly, which is the period when saw the gap close slightly. Still, by 2019 there was still a gap of roughly 7.0 percentage points, with the import price index rising by 9.8 percentage points since 2000, compared to an increase of just 2.8 percent in the new vehicle price index.
There was a larger gap between the new vehicle price index and the used vehicle price index. The used vehicle price index was actually 10.3 percent below its 2000 value in 2019, implying a gap of 13.1 percentage points between the new and used vehicle indexes over this 19-year period.
This story gets completely reversed in the years since the pandemic. Used vehicle prices are up by 37.2 percent, new vehicle prices are up by 20.1 percent, while the index for imported vehicles has increased by just 6.9 percent. This raises the question of whether there is some fundamental factor that has led to a lasting change in the pattern of new, used, and imported vehicles or whether this is a temporary story that will revert back to the pre-pandemic path in time.
Offhand, I can’t see any fundamental factor that has changed in a way that would affect these price trends. The dollar did rise in 2021 and earlier in 2022, which would lower imported car prices in the United States, but it is now pretty much back to its pre-pandemic level against most currencies, so currency valuations can’t explain much of the picture.
And, currency values won’t tell us anything about the far more rapid rise in used vehicle prices than new vehicle prices. This is easily explained in the context of pandemic shortages of cars, driving up used car prices, but if we envision a post-pandemic future where automakers can produce enough vehicles to meet demand, presumably, we will see the former pattern restored.
There may well be something that I am missing (suggestions welcome), but it still looks to me like we should expect the new vehicle index to converge towards the imported vehicle index and the used vehicle index to again drop below the new vehicle index. This path may take longer than I had expected, but it still seems likely.
That means that we should expect vehicle prices to be constraining inflation going forward. That may not be the case in the next couple of months, but it is likely to be true later in 2023 and into 2024.
Read More Leer más Join the discussion Participa en la discusión
• Affordable Care ActHealth and Social ProgramsLos Programas Sociales y de SaludSocial SecurityUnited StatesEE. UU.

A New York Times article on the economics and politics around Social Security and Medicare begins by telling readers:
President Biden scored an early political point this month in his fight with congressional Republicans over taxes, spending and raising the federal debt limit: He forced Republican leaders to profess, repeatedly, that they will not seek cuts to Social Security and Medicare.
In the process, Mr. Biden has effectively steered a debate about fiscal responsibility away from two cherished safety-net programs for seniors, just as those plans are poised for a decade of rapid spending growth.
It is not clear that “fiscal responsibility” has anything to do with this debate. First, it is not clear what that expression means. Would it have been fiscally responsible to have more deficit reduction in the years following the Great Recession, with the economy recovering slowly and unemployment remaining high?
In those circumstances, more deficit reduction would have meant slower growth and higher unemployment. Perhaps the New York Times would define deficit reduction that hurts the economy as being “fiscally responsible,” but it is not clear that most people would accept that definition.
The other part of the story is that Republicans have repeatedly demonstrated by their actions that they don’t care about budget deficits. Every time the Republicans have regained the White House in the last four decades, they have pushed through large tax cuts that resulted in large increases in the budget deficit.
Seeing this behavior, it is absurd to imagine that the leaders of the Republican Party are concerned about budget deficits (if this is how we are defining fiscal responsibility). They may claim to be concerned about budget deficits, but it would be irresponsible to imply that they actually are concerned about budget deficits.
In short, this is alleged to be a debate over “fiscal responsibility” or budget deficits. There is little reason to believe, at least on the Republican side, that this is actually a debate over budget deficits.
Spending on Social Security and Medicare Has Been Far Less Than Projected
It is also worth noting that the dynamics of the shortfalls facing Social Security and Medicare are somewhat different than implied by this piece. Social Security spending has already been rising rapidly, since most of the baby boom cohorts have already reached retirement age. Social Security spending rose from 4.19 percent of GDP in 2000 to 5.09 percent of GDP in 2023, an increase of 0.9 percentage points. It is projected to increase to 5.95 percent of GDP by 2040, a further rise of 0.84 percentage points.
This means that, in terms of its economic impact, we will not be seeing anything qualitatively different from what we had been seeing from Social Security. There is a different story going forward in that the dedicated trust fund built from the Social Security tax is projected to face a shortfall, but that is an issue of allocating governmental resources, not a question of requiring a more rapid diversion of resources to Social Security than we have been seeing for decades.
It is also worth noting that the cost increases for both Social Security and Medicare have been far less than had earlier been projected. The 2000 Social Security Trustees Report projected that Social Security spending would increase by 2.07 percentage points by 2025, to 6.26 percent of GDP. The 2022 Trustees report shows costs increasing by just 1.17 percentage points to 5.26 percent of GDP in 2025.
While there have not been explicit cuts to Social Security, changes in both practices and society have led to slower-than-projected cost growth. In the former category, a far higher rate of denial for disability claims has substantially reduced the cost of the disability program. In the latter category, the slower growth in life expectancy, especially for non-college-educated workers, has reduced the cost of the Social Security program. These are not necessarily positive developments, but they mean that Social Security is now costing far less than had been projected in the not-so-distant past.
There is a similar story with Medicare cost growth. Its spending was projected to rise by 0.61 percentage points to 2.0 percent of GDP in 2025. Its costs are now projected to rise to 1.68 percent of GDP in 2025, an increase of just 0.29 percentage points. This smaller increase is the result of a sharp slowing in healthcare cost growth after the passage of the Affordable Care Act in 2010. Here also, we have seen substantial savings against projected spending, even if there were no explicit cuts in the program.
Upward Redistribution Has Been a Major Factor in the Projected Social Security Shortfall
It is also worth noting that much of the projected shortfall in the Social Security program is due to the upward redistribution of income over the last four decades. In 1982, when the last major changes to Social Security were put into place, 90 percent of wage income fell below the cap on taxable wages (currently $160,200).
In the last two decades, just over 82 percent of wage income was subject to the Social Security tax (see page 148). There was also a redistribution from wage income to profit income, which further reduced Social Security tax revenue. Together, this upward redistribution accounts for more than 40 percent of the program’s projected shortfall over its 75-year planning horizon. If we had not shifted so much income to high-end earners and to profits, closing the projected shortfall in Social Security would be a far more manageable task.
Read More Leer más Join the discussion Participa en la discusión
There were several news stories on the 3.0 percent jump in retail sales the Commerce Department reported for January that took this as evidence that the economy was still very strong. In fact, since the January rise followed two months where reported sales fell sharply, the picture is far more ambiguous.
Reported sales fell by more than 1.0 percent in both November and December. As a result, reported sales in January were just 0.7 percent higher than those reported in October. Since these are nominal sales, it means that real retail sales have been close to flat over the last three months.
Likely, nominal sales did not really fall by more than 1.0 percent in November and December and then jumped by 3.0 percent in January. This is more likely an issue of seasonal adjustments for holiday shopping. Seasonal adjustments are always difficult, but post-pandemic shopping patterns make it harder for the Commerce Department to distinguish between sales changes reflected growth or weakness, as opposed to normal seasonal patterns.
In any case, when we get large changes like the 3.0 percent jump in sales reported in January, it is important to look back over the recent past to put them in context. No one looking at retail sales over the past three months can be concerned that they are growing too rapidly, even if the January jump, taken in isolation, might imply that.
Read More Leer más Join the discussion Participa en la discusión
According to news reports, Moderna is considering a price in the range of $110 to $130 for shots of its Covid booster. People may recall that we paid Moderna close to $450 million to develop its Covid vaccine. We then paid another $450 million for the clinical trials that were needed to determine its effectiveness.
Moderna has already made a good return on our tax dollars, selling the initial set of shots at around $20 a piece. According to Forbes, the company’s soaring stock price had already produced five billionaires by the summer of 2021.
Who knows how many Moderna billionaires we will have if the company gets away with charging $110-$130 for its new booster. Of course, this money will come out of the pockets of the rest of us, or at least those of us who are not prevented from getting boosters by these high prices.
Fortunately, there is an alternative if the Biden administration is prepared to challenge Moderna and drug companies more generally on their monopoly pricing. Peter Hotez and Elena Bottazzi, two highly respected researchers at Baylor University and Texas Children’s Hospital, developed a simple to produce, 100 percent open-source Covid vaccine. It uses well-established technologies that are not complicated (unlike mRNA). Their vaccine has been widely used in India and Indonesia, with over 100 million people getting the vaccine to date.
If we want to see the vaccine used here it would need to be approved by the Food and Drug Administration (FDA). In principle, the FDA could rely on the clinical trials used to gain approval in India, but it indicated that they want U.S. trials. (In fairness, India’s trials are probably lower quality.)[1]
However, the government could fund a trial of Hotez-Bottazzi vaccine (Corbevax) with pots of money left over from Operation Warp Speed, or alternatively from the budgets of National Institutes of Health or other agencies like Biomedical Advanced Research and Development Authority (BARDA). With tens of billions of dollars of government money going to support biomedical research each year, the ten million or so needed for a clinical trial of Corbevax would be a drop in the bucket.
The arithmetic on this is incredible. Shots of Corbevax cost less than $2 a piece in India. If it costs two and a half times as much in the U.S., that still puts it a $5 a shot. That implies savings of more than $100 a shot. That means that if we get 100,000 people to take the Corbevax booster, rather than the Modern-Pfizer ones (Pfizer is planning to also charge over $100 for its booster), we’ve covered the cost of the trials. If we get 1 million to take Corbevax, we’ve covered the cost ten times over, and if 10 million people get the Corbevax booster, we will have saved one hundred times the cost of the clinical trial.
There is also the advantage that, since at least some of the reason for vacine hesitancy is fears of mRNA vaccines. We may get some vaccine hesitant people to take Corbevax, who wouldn’t take the mRNA vaccines.
It is understandable that the pharmaceutical industry would be very unhappy if the Biden administration were to put up the money for a clinical trial of Corbevax. Not only would FDA approval seriously cut into the gold mine they were anticipating from selling boosters at more than $100 a shot, it would also be a dangerous example for the industry.
It would show that it is possible to develop effective vaccines without relying on government-granted patent monopolies. (Hotez and Bottazzi supported their research on small grants from the government and private foundations.) And, it would be a great reminder that vaccines (and drugs) are cheap. It is rare that it is actually expensive to manufacture and distribute a drug or vaccine. Drugs are expensive because we give companies patent monopolies, or other forms of protection.
If we pay for the research up front, we don’t have to gouge patients to recover development costs. And, we don’t give drug companies an enormous incentive to lie, cheat, and steal to maximize the value of their patent monopolies.
The Biden administration has a great opportunity to hugely advance public health, and set an incredibly important example, by putting up the money for a clinical trial of Corbevax. Bernie Sanders, as chair of the Senate Health Committee, can also get on the case. He has been critical of Moderna for charging outrageous prices for a vaccine developed with taxpayer money.
Sanders’ anger is quite justified. But rather than just haranguing the company into lowering its price, we can take away its ability to get away with charging $130 a shot by giving them some competition. Competition is great for capitalism, even if it may not be good for individual capitalists.
[1] It seems as though the pharmaceutical industry may also be working to slow the use of Corbevax outside of the United States. Hotez and Bottazzi have been unable to get the World Health Organization (WHO) to move on their request for pre-qualification, which they submitted back in June. They have been given no reason for the delay. This matters hugely for developing countries, because their health agencies are reluctant to approve a vaccine that the WHO has not pre-qualified.
Read More Leer más Join the discussion Participa en la discusión
• Economic Crisis and RecoveryCrisis económica y recuperaciónEconomic GrowthEl DesarolloInequalityLa DesigualdadUnited StatesEE. UU.

Read More Leer más Join the discussion Participa en la discusión
Okay, that’s not exactly what the NYT told us. A piece, headlined “The Medicine is a Miracle, but only if You Can Afford It,” told readers how patients struggle to pay for drugs that sell for tens, or even hundreds, of thousands a dollars a year. The piece describes people taking out GoFundMe pages or seeking out foundations that would pay for treatments that can improve their health and/or save their lives.
While the piece tells us that drug companies invest lots of money in developing these drugs or treatments, it neglects to mention that the we could eliminate this problem if we simply paid for the research up front. This would mean having the government pick up the tab for the research, as it already does with over $50 billion a year of funding to the National Institutes of Health, and then having all new drugs and treatments available as cheap generics. In that situation, we would not be forcing people with serious illnesses to run around begging for money to get effective treatments.
Read More Leer más Join the discussion Participa en la discusión
• HealthcareIntellectual PropertyPropiedad IntelectualUnited StatesEE. UU.

Read More Leer más Join the discussion Participa en la discusión
Read More Leer más Join the discussion Participa en la discusión
• Affordable Care ActHealth and Social ProgramsLos Programas Sociales y de SaludHealthcareSocial SecurityUnited StatesEE. UU.

Read More Leer más Join the discussion Participa en la discusión
In the last year or so there have been many people who complained about China’s “vaccine nationalism.” This generally meant the country refused to approve the U.S. mRNA vaccines. The claim was that our mRNA vaccines were far superior to China’s old-fashioned dead virus vaccines. The argument went that the country needed to maintain its zero Covid policy, otherwise, the pandemic would devastate its unprotected population.
Well, we have now gotten the opportunity to test that claim. There is little doubt that the abrupt ending of pandemic restrictions led to much death and suffering in China. The government is not being open about the pandemic toll, but even the high-end estimates put the number of deaths at around 1 million.
That is a terrible number of lives lost, but the official count in the U.S. is over 1.1 million deaths. The number of Covid-related excess deaths that were not recorded would push this figure at least 200,000 higher. With four times the population, if China were to be similarly hard-hit it would be seeing well over 5 million deaths.
The current omicron strain is less fatal than the original alpha and delta strains, but plenty of people, including vaccinated people, have died from the omicron strain. Clearly the Chinese vaccines have done a reasonably job protecting China’s population.
We didn’t need this gigantic test to know that China’s vaccines were effective. We actually had some good data from studies that compared the effectiveness of China’s vaccines with the mRNA vaccines. While one study found that the Chinese vaccines were somewhat less effective, they still would prevent the overwhelming majority of the population from getting seriously ill from the disease. The other study found that with a booster shot, one of the Chinese vaccines was actually trivially more effective in preventing death in older people.
The major issue with China was not that it lacked an effective vaccine, its biggest problem in coping with the opening of the country was its failure to get much of its elderly population fully vaccinated and boosted. It’s not clear that President Xi gave a damn about the advice he was getting from our elite policy types, but their complaint that vaccine nationalism was keeping him from buying our mRNA vaccines was nonsense.
If they wanted to give useful advice to Xi, they would have harped on his failure to get China’s elderly population fully vaccinated. This is something that could have in principle been remedied fairly quickly. The idea of quickly shipping over billions of doses of Pfizer or Moderna’s vaccines was the sort of thing that would be laughed at anywhere other than the pages of the Washington Post.
Furthermore, the obsession with mRNA vaccines is incredibly silly. There are a number of non-mRNA vaccines that have been widely administered to billions of people around the world, providing protection that is comparable to the mRNA vaccines. Most notable in this category is the Oxford-AstraZeneca vaccine, which was widely used in Europe. Our elite policy types have not felt the need to denounce European countries for vaccine nationalism for their failure to ensure that their populations received a mRNA vaccine.
The fact is that we have done a horrible job dealing with the pandemic. Our policy was always more focused on making Moderna billionaires than protecting people here and around the world from the pandemic. If saving lives had been the focus of policy we would have worked together with researchers around the world (including China), pooling technology and allowing anyone anywhere in the world to produce any vaccines that were determined to be effective. Not only would more rapid dispersion of vaccines, along with tests and treatments, have saved lives in developing countries, by slowing the spread it may have prevented the development of new strains of the pandemic that led to massive waves of infections here.
And, just to be clear, this is not a question of relying on the market rather than government. In spite of what we hear from the policy types who dominate public debate, government-granted patent monopolies, and related forms of intellectual property, are not the free market. These are policies that we have chosen for promoting innovation, they do not amount to leaving things to the market, even if their beneficiaries would like us to believe otherwise.
Read More Leer más Join the discussion Participa en la discusión


