


Okay, I’m not really defending private equity, but I do have to point out that Marc Hogan has badly misrepresented the problems in the music industry in his New York Times column this morning.
Hogan would have us believe that we have a thriving music industry that is being swallowed up by money-grubbing private equity companies that now lay claim to a large share of artists’ recordings. While private equity companies undoubtedly engage in many sleazy practices, the fact is that the industry is hardly thriving. Hogan gets the story completely wrong.
He tells readers:
“The music industry’s revenues recently hit a new high, with major labels raking in record earnings,”
The link is to an industry publication that reports revenue from recorded music for the first half of 2023 at a record $8.4 billion. That would translate to $16.8 billion on an annual basis. If we go back to 2000, before streaming or digital downloads were common, sales were $19.1 billion. In nominal dollars, the economy is more than two and half times as large today as in 2000.
This means that if recorded music was as large a share of the economy today, as at the start of the century, revenue would have to be almost $45 billion a year. Relative to the size of the economy, streaming revenue is just over one-third as large today as in 2000. (Some of the revenue in 2000 went to the manufacture and distribution of physical discs, but this would have been a small share of the total.) This loss of revenue is the core problem with the music industry, not the dealings of private equity companies.
As a practical matter, rapacious corporations or promoters ripping off musicians is not exactly a new story. It’s possible that it is worse today, but it is absurd to imagine a golden age where most musicians could count on being paid well for their work.
Hogan inadvertently gives away the story when he cites Spotify’s decision to stop sending out royalty checks for songs with fewer than 1,000 streams in a year. People who follow his link would find that 1000 streams would net a performer $3. Things would have to be pretty bad indeed if that is going to make a noticeable difference for “artists on the lower rungs.”
The real problem is that we need to find ways to get more money to musicians and songwriters. The current system is not working and that would be true even if private equity didn’t exist.
There are alternatives that can do the trick, such as individual tax credits to support creative work. I have suggested a similar route for reviving local journalism, another area where the NYT is badly out to lunch.
There is an old saying that intellectuals have a hard time dealing with new ideas. The New York Times opinion section seems determined to demonstrate its truth on a regular basis.
Read More Leer más Join the discussion Participa en la discusión
Yes, I am serious. That is the answer that the New York Times opinion page gave us this morning. The argument is that if students leaving school didn’t have so much debt, it would be easier for them to take relatively low-paying jobs in journalism.
This is incredibly annoying for two reasons. First, there are serious proposals for trying to save local (and national) news outlets. The New York Times has chosen not to give these options space on its opinion pages, although it has featured people whining about the decline of the industry. (Yes, I tried to get a piece in, as I’m sure have others.) The point is that if we want to have local journalism, we need to create a way to pay for it, getting lower cost labor is not the answer.
The other reason that this piece is painful is that the author is apparently ignorant of President Biden’s income-driven student debt repayment plan. Under this plan, most people with low wages would not be seriously burdened by student loan debt.
A person earning the $56,000 median pay for journalists noted in the article would be paying $193 a month under the plan, if they were single with no kids. If they had one kid, they would be paying $97 a month.
And, if they made less than this, as would be the case for half of journalists, they would be paying less. A single journalist with no kids earning $40,000 would be paying $60 a month. They would be paying zero if they had one kid and they earned this salary.
In short, with Biden’s student loan repayment plan, student debt should not be a major burden for people working at low-paying jobs in journalism. This means that free journalism school will be an incredibly trivial subsidy to the industry.
It also is striking that the New York Times cannot seem to find out about the Biden’s administration’s income-driven loan repayment plan. There seems to be little knowledge among the general public of this plan, including among millions who could benefit from it. Maybe if the media outlets like the New York Times had more competent editors and reporters there would be greater public awareness of this important program.
Read More Leer más Join the discussion Participa en la discusión
The Washington Post made some serious errors or omissions in its 11 charts that are supposed to tell us how Covid changed the economy.
Wages
Starting with its second chart, the article gives us an index of average weekly wages since 2019. The index shows a big jump in 2020, which then falls off in 2021 and 2022, before rising again in 2023.
It tells readers:
“Many Americans got large pay increases after the pandemic, when employers were having to one-up each other to find and keep workers. For a while, those wage gains were wiped out by decade-high inflation: Workers were getting larger paychecks, but it wasn’t enough to keep up with rising prices.”
That actually is not what its chart shows. The big rise in average weekly wages at the start of the pandemic was not the result of workers getting pay increases, it was the result of low-paid workers in sectors like hotels and restaurants losing their jobs.
The number of people employed in the low-paying leisure and hospitality sector fell by more than 8 million at the start of the pandemic. Even at the start of 2021 it was still down by over 4 million.
Laying off low-paid workers raises average wages in the same way that getting the short people to leave raises the average height of the people in the room. The Washington Post might try to tell us that the remaining people grew taller, but that is not what happened.
The other problem with this chart is that it is giving us weekly wages. The length of the average workweek jumped at the start of the pandemic as employers decided to work the workers they had longer hours rather than hire more workers. In January of 2021 the average workweek was 34.9 hours, compared to 34.4 hours in 2019 and 34.3 hours in February.
This increase in hours, by itself, would raise weekly pay by 2.0 percent. As hours returned to normal in 2022, this measure would misleadingly imply that wages were falling.
It is also worth noting that the fastest wage gains since the pandemic have been at the bottom end of the wage distribution and the Black/white wage gap has fallen to its lowest level on record.
Saving Rates
The third chart shows the saving rate since 2019. It shows a big spike at the start of the pandemic, as people stopped spending on things like restaurants and travel and they got pandemic checks from the government. It then falls sharply in 2022 and is lower in the most recent quarters than in 2019.
The piece tells readers:
“But as the world reopened — and people resumed spending on dining out, travel, concerts and other things that were previously off-limits — savings rates have leveled off. Americans are also increasingly dip into rainy-day funds to pay more for necessities, including groceries, housing, education and health care. In fact, Americans are now generally saving less of their incomes than they were before the pandemic.
This is an incomplete picture due to a somewhat technical issue. As I explained in a blogpost a few months ago, there is an unusually large gap between GDP as measured on the output side and GDP measured on the income side. In principle, these two numbers should be the same, but they never come out exactly equal.
In recent quarters, the gap has been 2.5 percent of GDP. This is extraordinarily large, but it also is unusual in that the output side is higher than the income side, the opposite of the standard pattern over the last quarter century.
It is standard for economists to assume that the true number for GDP is somewhere between the two measures. If we make that assumption about the data for 2023, it would imply that income is somewhat higher than the data now show and consumption somewhat lower.
In that story, as I showed in the blogpost, the saving rate for 2023 would be 6.8 percent of disposable income, roughly the same as the average for the three years before the pandemic. This would mean that people are not dipping into their rainy-day funds as the Post tells us. They are spending pretty much as they did before the pandemic.
Credit Card Debt
The next graph shows that credit card debt is rising again, after sinking in the pandemic. The piece tells readers:
“But now, debt loads are swinging higher again as families try to keep up with rising prices. Total household debt reached a record $17.5 trillion at the end of 2023, according to the Federal Reserve Bank of New York. And, in a worrisome sign for the economy, delinquency rates on mortgages, car loans and credit cards are all rising, too.”
There are several points worth noting here. Credit card debt is rising, but measured relative to income it is still below where it was before the pandemic. It was 6.7 percent of disposable income at the end of 2019, compared to 6.5 percent at the end of last year.
The second point is that a major reason for the recent surge in credit card debt is that people are no longer refinancing mortgages. There was a massive surge in mortgage refinancing with the low interest rates in 2020-2021.
Many of the people who refinanced took additional money out, taking advantage of the increased equity in their home. This channel of credit was cut off when mortgage rates jumped in 2022 and virtually ended mortgage refinancing. This means that to a large extent the surge in credit card borrowing is simply a shift from mortgage debt to credit card debt.
The point about total household debt hitting a record can be said in most months. Except in the period immediately following the collapse of the housing bubble, total debt is almost always rising.
And the rise in delinquencies simply reflects the fact that they had been at very low levels in 2021 and 2022. For the most part, delinquency rates are just getting back to their pre-pandemic levels, which were historically low.
Grocery Prices and Gas Prices
The next two charts show the patterns in grocery prices and gas prices since the pandemic. It would have been worth mentioning that every major economy in the world saw similar run-ups in prices in these two areas. In other words, there was nothing specific to U.S. policy that led to a surge in inflation here.
The Missing Charts
There are several areas where it would have been interesting to see charts which the Post did not include. It would have been useful to have a chart on job quitters, the number of people who voluntarily quit their jobs during the pandemic. In the tight labor markets of 2021 and 2022 the number of workers who left jobs they didn’t like soared to record levels, as shown below.
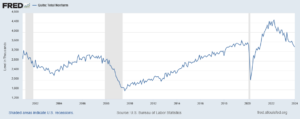
The vast majority of these workers took other jobs that they liked better. This likely explains another item that could appear as a graph, the record level of job satisfaction.
In a similar vein there has been an explosion in the number of people who work from home at least part-time. This has increased by more than 17 million during the pandemic. These workers are saving themselves thousands of dollars a year on commuting costs and related expenses, as well as hundreds of hours spent commuting.
Finally, there has been an explosion in the use of telemedicine since the pandemic. At the peak, nearly one in four visits with a health care professional was a remote consultation. This saved many people with serious health issues the time and inconvenience associated with a trip to a hospital or doctor’s office. The increased use of telemedicine is likely to be a lasting gain from the pandemic.
The World Has Changed
The pandemic will likely have a lasting impact on the economy and society. The Washington Post’s charts captured part of this story, but in some cases misrepresented events in important ways.
The Washington Post made some serious errors or omissions in its 11 charts that are supposed to tell us how Covid changed the economy.
Wages
Starting with its second chart, the article gives us an index of average weekly wages since 2019. The index shows a big jump in 2020, which then falls off in 2021 and 2022, before rising again in 2023.
It tells readers:
“Many Americans got large pay increases after the pandemic, when employers were having to one-up each other to find and keep workers. For a while, those wage gains were wiped out by decade-high inflation: Workers were getting larger paychecks, but it wasn’t enough to keep up with rising prices.”
That actually is not what its chart shows. The big rise in average weekly wages at the start of the pandemic was not the result of workers getting pay increases, it was the result of low-paid workers in sectors like hotels and restaurants losing their jobs.
The number of people employed in the low-paying leisure and hospitality sector fell by more than 8 million at the start of the pandemic. Even at the start of 2021 it was still down by over 4 million.
Laying off low-paid workers raises average wages in the same way that getting the short people to leave raises the average height of the people in the room. The Washington Post might try to tell us that the remaining people grew taller, but that is not what happened.
The other problem with this chart is that it is giving us weekly wages. The length of the average workweek jumped at the start of the pandemic as employers decided to work the workers they had longer hours rather than hire more workers. In January of 2021 the average workweek was 34.9 hours, compared to 34.4 hours in 2019 and 34.3 hours in February.
This increase in hours, by itself, would raise weekly pay by 2.0 percent. As hours returned to normal in 2022, this measure would misleadingly imply that wages were falling.
It is also worth noting that the fastest wage gains since the pandemic have been at the bottom end of the wage distribution and the Black/white wage gap has fallen to its lowest level on record.
Saving Rates
The third chart shows the saving rate since 2019. It shows a big spike at the start of the pandemic, as people stopped spending on things like restaurants and travel and they got pandemic checks from the government. It then falls sharply in 2022 and is lower in the most recent quarters than in 2019.
The piece tells readers:
“But as the world reopened — and people resumed spending on dining out, travel, concerts and other things that were previously off-limits — savings rates have leveled off. Americans are also increasingly dip into rainy-day funds to pay more for necessities, including groceries, housing, education and health care. In fact, Americans are now generally saving less of their incomes than they were before the pandemic.
This is an incomplete picture due to a somewhat technical issue. As I explained in a blogpost a few months ago, there is an unusually large gap between GDP as measured on the output side and GDP measured on the income side. In principle, these two numbers should be the same, but they never come out exactly equal.
In recent quarters, the gap has been 2.5 percent of GDP. This is extraordinarily large, but it also is unusual in that the output side is higher than the income side, the opposite of the standard pattern over the last quarter century.
It is standard for economists to assume that the true number for GDP is somewhere between the two measures. If we make that assumption about the data for 2023, it would imply that income is somewhat higher than the data now show and consumption somewhat lower.
In that story, as I showed in the blogpost, the saving rate for 2023 would be 6.8 percent of disposable income, roughly the same as the average for the three years before the pandemic. This would mean that people are not dipping into their rainy-day funds as the Post tells us. They are spending pretty much as they did before the pandemic.
Credit Card Debt
The next graph shows that credit card debt is rising again, after sinking in the pandemic. The piece tells readers:
“But now, debt loads are swinging higher again as families try to keep up with rising prices. Total household debt reached a record $17.5 trillion at the end of 2023, according to the Federal Reserve Bank of New York. And, in a worrisome sign for the economy, delinquency rates on mortgages, car loans and credit cards are all rising, too.”
There are several points worth noting here. Credit card debt is rising, but measured relative to income it is still below where it was before the pandemic. It was 6.7 percent of disposable income at the end of 2019, compared to 6.5 percent at the end of last year.
The second point is that a major reason for the recent surge in credit card debt is that people are no longer refinancing mortgages. There was a massive surge in mortgage refinancing with the low interest rates in 2020-2021.
Many of the people who refinanced took additional money out, taking advantage of the increased equity in their home. This channel of credit was cut off when mortgage rates jumped in 2022 and virtually ended mortgage refinancing. This means that to a large extent the surge in credit card borrowing is simply a shift from mortgage debt to credit card debt.
The point about total household debt hitting a record can be said in most months. Except in the period immediately following the collapse of the housing bubble, total debt is almost always rising.
And the rise in delinquencies simply reflects the fact that they had been at very low levels in 2021 and 2022. For the most part, delinquency rates are just getting back to their pre-pandemic levels, which were historically low.
Grocery Prices and Gas Prices
The next two charts show the patterns in grocery prices and gas prices since the pandemic. It would have been worth mentioning that every major economy in the world saw similar run-ups in prices in these two areas. In other words, there was nothing specific to U.S. policy that led to a surge in inflation here.
The Missing Charts
There are several areas where it would have been interesting to see charts which the Post did not include. It would have been useful to have a chart on job quitters, the number of people who voluntarily quit their jobs during the pandemic. In the tight labor markets of 2021 and 2022 the number of workers who left jobs they didn’t like soared to record levels, as shown below.
The vast majority of these workers took other jobs that they liked better. This likely explains another item that could appear as a graph, the record level of job satisfaction.
In a similar vein there has been an explosion in the number of people who work from home at least part-time. This has increased by more than 17 million during the pandemic. These workers are saving themselves thousands of dollars a year on commuting costs and related expenses, as well as hundreds of hours spent commuting.
Finally, there has been an explosion in the use of telemedicine since the pandemic. At the peak, nearly one in four visits with a health care professional was a remote consultation. This saved many people with serious health issues the time and inconvenience associated with a trip to a hospital or doctor’s office. The increased use of telemedicine is likely to be a lasting gain from the pandemic.
The World Has Changed
The pandemic will likely have a lasting impact on the economy and society. The Washington Post’s charts captured part of this story, but in some cases misrepresented events in important ways.
Read More Leer más Join the discussion Participa en la discusión
The media have run endless pieces about people being upset because prices are not falling back to their pre-pandemic level. They treat this as some great mystery that has people endlessly annoyed. The Wall Street Journal gave us the latest entry in this genre, a piece headlined, “we still don’t believe how much things cost.”
There actually is a very simple answer that is known to everyone who has ever sat in an intro econ class, wages have risen sharply over the last four years. The average hourly wage is up by just over 21.0 percent from its pre-pandemic level. That puts it slightly ahead of the 20.0 percent increase in the Consumer Price Index over this period.
That’s not a great story, but there have been many periods over the last half century when wages have trailed prices. And given that we faced a worldwide pandemic that led to a burst of inflation everywhere, it’s actually a damn good picture. Workers in most other countries have seen their wages fall behind prices.
But getting to the issue of why prices don’t fall, given that wages are 21 percent higher than they were four years ago, it would take some pretty fanciful reasoning to construct a story where prices fall back to their pre-pandemic level. Wages account for around 60 percent of costs. If wages are up 21 percent, it’s pretty hard to see how prices can get back to where they were four years ago.
Of course, the WSJ decided to emphasize its point by finding items that have seen exceptionally large price increases. That might help to push a “the economy is awful” story, but it is not a very useful way to inform readers about the economy.
Read More Leer más Join the discussion Participa en la discusión
President Biden’s budget calls for quadrupling the tax on share buybacks to 4.0 percent. This is a great way to raise revenue, since it is probably the most efficient tax ever devised.
The neat thing about taxing share buybacks is that they are publicly announced. Companies have to tell shareholders that they are buying back shares.
If management lies, they don’t just have to worry about the government, they have to worry about their own shareholders. Management would then both face serious civil and criminal penalties. They might be willing to rip off shareholders to fatten their own paychecks, but few CEOs will risk their own wealth, as well as jail time, to save their company a few dollars on taxes.
The Biden administration projected that increasing this tax would raise $160 billion over the next decade. This is not huge in terms of the federal budget (it’s a bit more than 0.2 percent of projected spending), but on an annual basis, the $16 billion it would raise is roughly one-fourth of the amount at stake in Biden’s aid request for Ukraine.
While some have demonized share buybacks, it is hard to see why they are any worse than paying out money to shareholders as dividends. Insofar as this tax changes corporate behavior it will most likely be to get them to pay more money in dividends and use less for share buybacks. That’s fine, but no one should expect an investment boom from taxing share buybacks.
The big benefit from the buyback tax is that it can be a step towards shifting the basis of the corporate income tax from profits to returns to shareholders (dividends plus capital gains). The reason why this is such a big deal is that this shift would effectively put the tax gaming industry out of business.
The I.R.S. can’t see corporate profits directly, they have to rely on corporate accountants to tell them what their companies’ profits are. These accountants have an enormous incentive to find ways to game the tax code to make their taxable profits look less than their actual profits.
The accountants and their lawyer accomplices have developed hundreds of elaborate schemes to hide profits with various tricks and maximize the value of every loophole. Tens of billions of dollars is wasted every year running these schemes with much investment shifted for no reason other than to reduce tax liabilities.
If instead the basis for the corporate income tax was stock returns, we don’t have to care what the accountants say or do. This information is publicly available on dozens of financial websites. The I.R.S. could in a matter of minutes calculate the tax liability of every publicly traded corporation in the country on a single spreadsheet.
The only way to get out of paying the tax a company owes would be for the management to cheat their shareholders. Again, that is not likely to be a very promising path, since they could end up paying large fines and going to jail. Rich shareholders don’t like to be cheated.
There are some issues, but they are trivial compared to the current system. We would probably want to allow some sort of averaging so that a company whose stock suddenly surged would not face a huge tax liability in that year. On the other hand, if the surge proved enduring, they would have a high tax bill, which is appropriate. (If they don’t have a lot of cash on hand to pay their taxes, they could always sell shares.)
There is also an issue of allocating the returns across countries. This is the same problem we have now with the profits-based tax. The obvious solution is to divide the tax among countries in accordance with their share of revenue from each one. That may not be perfect, but there will never be a perfect tax system.
Note that this switch says nothing about tax rates, we can make the tax rate 5.0 percent or 35.0 percent, the point is that whatever rate we set, we can know that we will collect it. And we know that companies will not waste huge amounts of resources trying to avoid or evade the tax because they won’t be able to do it.
This switch would be a huge victory for those who want to see a fair and efficient tax system. The tax on buybacks is a big step down this path, with a bit of luck we will be able to go the rest of the way.
Read More Leer más Join the discussion Participa en la discusión
When we hear about inflation most of us probably think of items like food, gas, and rent, but when it comes to the Consumer Price Index (CPI), the most frequently cited measure of inflation, auto insurance has played a very large role in recent years. The index for motor vehicle insurance rose 0.9 percent in July and was responsible for 0.024 percentage points of the 0.4 percent inflation reported for February.
Over the last year the insurance index has risen 20.6 percent and is responsible for just over 0.5 percentage points of the 3.2 percent inflation rate in the overall CPI. It accounts for more than 0.6 percentage points of the 3.8 percent inflation shown in the core index over the last year. We would likely be thinking about inflation very differently if the auto insurance index showed a more moderate rate of inflation.
Part of the story with rising auto insurance prices reflects inflation in the relevant sectors of the economy. New and used car prices rose rapidly in the pandemic due to supply chain problems. We also saw a big increase in the price of car parts for the same reason. And, auto repair prices also rose rapidly, partly due to higher prices for parts, but also due to labor shortages pushing up pay in the industry.
This part of the insurance inflation story is diminishing as inflation in these components comes under control. New vehicle prices have risen just 0.4 percent over the last year and used vehicle prices are down 1.6 percent.
The index for parts and equipment fell 0.5 percent over the last year, after peaking with a year over year increase of more than 15 percent in 2022. The index for maintenance and repairs rose 6.7 percent over the last year, but that is down from a peak of 14.2 percent at the start of last year.
These inflation-driven aspects of auto insurance prices are coming under control, but that is only part of the story of the rise in the insurance index. The other part is simply that there is more damage to cars and passengers.
There are many factors here. We have seen a rise in accident rates since the pandemic. There also is more damage due to climate-related events like hurricanes and flooding. Insofar as these factors lead to higher insurance premiums, this will be picked up in the CPI insurance index, since it simply measures the premiums that drivers pay.
This is in contrast to the auto insurance component of the Personal Consumption Expenditure Deflator (PCE). That component uses a net measure of the cost of auto insurance, which subtracts out the amount paid to customers in claims.
The insurance component in the PCE has a much lower weight in the index, just 0.57 percent, compared to 2.83 percent in the CPI. It also shows a considerably lower rate of inflation, rising just 6.6 percent over the last year.
What Should Count as Inflation?
This differing treatment raises an interesting conceptual issue about how we think about the CPI, inflation, and the cost of living. The CPI measures the change in the price of a fixed basket of goods and services. The basket changes every year, but it doesn’t pick up the effect of people switching, say from beef to chicken, in response to a change in relative prices, if beef prices rise more than chicken prices.
This issue has often been raised as a reason the CPI is inadequate as a measure of the cost of living, meaning that it overstates the true increase in the cost of living. In reality, this sort of “substitution” actually doesn’t matter much. An index that allows for the effect of substitution, like the PCE, shows a 0.2-0.3 pp lower rate of inflation. That can add up over time, but it doesn’t really qualitatively change our view of inflation.
The more important issue is how we deal with societal changes, as is happening with auto insurance. Suppose auto insurance costs more because more bad things are happening, like accidents or floods destroying cars. The PCE measure of insurance would not show this as an increase in the cost of living. The logic is that we are not actually paying a higher price for the same insurance, we are paying more because we are effectively getting more insurance.
This is in some sense true, but the only reason we need to buy more insurance is because drivers have become more reckless, or climate change is causing more damage. These changes have increased our cost of living, but in ways that may not be picked up in measured inflation.
To take a similar story, suppose crime in a neighborhood has exploded. Now people routinely get burglar alarms, put in extra locks and bars on windows, and get vicious dogs to discourage intruders. These are all higher costs that these people will incur, but none of them are included in the CPI or any other inflation measure.
Healthcare presents similar problems. Our inflation indexes measure the cost of specific treatments. But we don’t actually value the treatments — most of us would probably be happy never having to see the doctor – we value our health.
When a new disease appears, like Covid in 2020 or AIDS in the 1980s, the cost of treatment for the new disease is not factored into the inflation indexes. In fact, when the cost of a treatment declines, as when a drug goes off patent and the availability of generics drive down the price, the new disease has the effect of lowering the measured rate of inflation.
To my view, the best way to measure the cost of healthcare in an inflation index is to measure what we pay and simply deduct it from our disposable income. We have separate measures to evaluate health. People’s health may improve because they eat better, exercise more, or have a healthier environment. These outcomes imply an improvement in living standards in most people’s book even if we are not getting more drugs, tests, or medical procedures.
We also have problems that items become necessities, but the associated spending is not picked up in the CPI or other inflation measures. The Internet is great but try getting by without it. It really is necessary now to be on-line to be able to get access to a wide swath of information, much of which used to be available through other channels. (Have you seen a phone book lately?).
However, the cost of monthly Internet access, or the device needed to get on the Internet (phone or computer), does not appear as increase in the cost of living in our inflation indexes. There are many other items that fall into the same category. A car could be considered a luxury for most people 70 years ago. Now that many cities are pretty much designed around cars, it would be very difficult to get around without one.
Anyhow, this is a long way of saying that the cost of living can be a difficult concept. The CPI’s treatment of car insurance provides an interesting window on the issue. This measure is one way in which the effects of global warming will show up in the measured rate of inflation. Unfortunately, it is not the only way in which it will affect the cost-of-living.
Read More Leer más Join the discussion Participa en la discusión
We know that the media are busy covering the fact that President Biden is 81, but if they ever have a reporter, or maybe an intern, with a few spare minutes perhaps they could ask Donald Trump about his plans for cutting Social Security and Medicare. On Monday, Trump indicated his desire to cut these programs, saying on a television show:
“Tremendous bad management of entitlements. There’s tremendous amounts of things and numbers of things you can do. So I don’t necessarily agree with the statement ….” “First of all, there is a lot you can do in terms of entitlements, in terms of cutting, and in terms of, also, the theft and bad management of entitlements, …”
Later, his campaign referred reporters to a post that they had made on Twitter:
“If you losers didn’t cut his answer short, you would know President Trump was talking about cutting waste,”
As is common for Trump, his statement is not very coherent, but since the media practice affirmative action for the lazy sons of billionaires, that fact will likely not get much attention. But he does seem to be talking about cutting Social Security and Medicare benefits.
But let’s follow the path suggested by his campaign. Trump wants to eliminate waste. It would be good if the media could press Trump on what waste he sees in these programs.
In the case of Social Security, the administrative costs of the program come to less than 0.4 percent of the benefits that are paid out each year. This is around one-thirtieth of the fees that private sector 401(k)s charge.
But let’s say that Trump can find waste that he somehow overlooked in his first term, how much can he hope to save, will he reduce administrative costs by a quarter, by a third, by half? In that incredibly optimistic scenario, he would reduce the cost of the program by 0.2 percent. That would barely affect any of the numbers in the Social Security projections.
What about the “theft?” Well again, one has to wonder why he let this “theft” go unchallenged in his four years in the White House, but it would be good if Trump could give us some idea of what sort of theft he has in mind. Otherwise, we might think this is just like his tens of thousands of dead people voting in Georgia, or his 30,000 sq foot condo that is actually 10,000 sq feet, in other words, a complete figment of Trump’s imagination.
We do know that many people have sought to find theft in the Social Security program. In 2013, the Washington Post famously ran a huge front page article, that also took up the entire back page, which revealed that the program had paid 0.006 percent of its benefits over the prior three years to dead people. According to the article, roughly half of this money was repaid. It seems that the main issue was that family members often did not report the death of a beneficiary immediately and may have received a check or two after the person’s death, something that is easily imaginable in the era of direct deposit.
But let’s suppose that Trump’s vigilance can reduce the amount lost in payments to dead people by 50 percent, or 0.0015 percent of total payments. That would not go far towards reducing the program’s costs, but on the plus side the impact would be so small we wouldn’t have to change any of the numbers in the Trustees projections.
The prospect for savings is not much better on the Medicare side. Here it is worth noting that cost projections have come down hugely over the last quarter century and especially since the passage of the Affordable Care Act in 2010. Healthcare spending has largely leveled off as a share of GDP and even fallen somewhat in the last few years.
Perhaps Donald Trump thinks he has some magic wand that will reduce Medicare costs further. The media should treat Trump like a serious candidate and ask him what his trick is, and why he didn’t use it in his first term in office.
Medicare and Social Security are really big deals. There are more than 60 million beneficiaries of both programs and tens of millions more people expect to be receiving these benefits in the next ten or fifteen years. If Donald Trump wants to cut these programs people have a right to know.
We all know it’s very important that Joe Biden is 81, but maybe the media could shift its focus for just a few minutes to tell people about Donald Trump’s plans for Social Security and Medicare. Voters should be able to know before they cast their votes.
Read More Leer más Join the discussion Participa en la discusión
There have been lots of reports in the media about China’s economic problems in recent months. Most of these pieces imply that it is facing some imminent disaster.
I will claim no special expertise on China, and it certainly looks like its government is pursuing some seriously wrongheaded policies, but it’s pretty difficult to see the disaster story in any publicly available data.
At the most basic level, most projections show its economy continuing to grow at a very healthy pace for the foreseeable future. Nonetheless, the coverage is almost exclusively negative.
For example, this New York Times piece noted China’s projection for 5.0 percent GDP growth in 2024 with the headline “Xi Sticks to His Vision for China’s Rise Even as Growth Slows.” China’s growth projections, as well as its official statistics, should be taken with a grain of salt. Nonetheless, few doubt that the picture shown by government data, of an extremely rapidly growing economy over the last four and half decades, is basically right.
But suppose we don’t want to take China’s projections for 2024 and instead turn to the I.M.F. as a more neutral source. The most recent projections from the I.M.F. show China’s economy growing 4.2 percent in 2024. Its growth is projected to remain above 4.0 percent for the following two years, and then fall somewhat below 4.0 percent for the last two years of its projection period.
Is this an economy in crisis? Well, it is undoubtedly slower than the near double-digit growth rates its economy chalked up for much of the period between 1980 and 2020, but it hardly seems like a crisis.
To see this point, we can compare the projected growth for China with the projected growth over this period for Mexico, a country with a nearly identical level of per capita income. This is shown below.
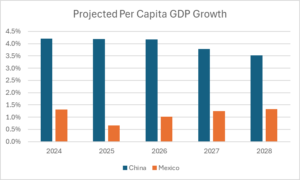
Source: International Monetary Fund.
As can be seen, Mexico is projected to have per capita income growth over this period averaging just over 1.0 percent annually, less than a third of China’s pace. (I have used per capita GDP to adjust for the fact that Mexico still has a growing population whereas China’s is declining slightly. Per capita GDP is a better gauge of living standards.) If we are to believe that China’s economy is facing some sort of crisis, then what do we think about an economy that is growing at less than a third of its pace?
It is also worth noting that, by this purchasing power parity measure, China’s economy is already considerably larger than the U.S. economy. It was 22.0 percent larger last year (24.0 percent including Hong Kong.) With the more rapid projected growth rate, it will be 34.0 percent larger by 2028.
This gap is worth noting when thinking about how best to deal with China. Those who think we can spend the country into the ground with a major military buildup need to check their arithmetic. (The Soviet economy peaked at roughly 60 percent of the size of the U.S. economy.)
The U.S. has differences with China in many areas, but both countries will fare much better if they look for areas for cooperation, like healthcare and climate, rather than confrontation. President Biden seemed to acknowledge this in his State of the Union address. It will be good if he follows through.
There have been lots of reports in the media about China’s economic problems in recent months. Most of these pieces imply that it is facing some imminent disaster.
I will claim no special expertise on China, and it certainly looks like its government is pursuing some seriously wrongheaded policies, but it’s pretty difficult to see the disaster story in any publicly available data.
At the most basic level, most projections show its economy continuing to grow at a very healthy pace for the foreseeable future. Nonetheless, the coverage is almost exclusively negative.
For example, this New York Times piece noted China’s projection for 5.0 percent GDP growth in 2024 with the headline “Xi Sticks to His Vision for China’s Rise Even as Growth Slows.” China’s growth projections, as well as its official statistics, should be taken with a grain of salt. Nonetheless, few doubt that the picture shown by government data, of an extremely rapidly growing economy over the last four and half decades, is basically right.
But suppose we don’t want to take China’s projections for 2024 and instead turn to the I.M.F. as a more neutral source. The most recent projections from the I.M.F. show China’s economy growing 4.2 percent in 2024. Its growth is projected to remain above 4.0 percent for the following two years, and then fall somewhat below 4.0 percent for the last two years of its projection period.
Is this an economy in crisis? Well, it is undoubtedly slower than the near double-digit growth rates its economy chalked up for much of the period between 1980 and 2020, but it hardly seems like a crisis.
To see this point, we can compare the projected growth for China with the projected growth over this period for Mexico, a country with a nearly identical level of per capita income. This is shown below.
Source: International Monetary Fund.
As can be seen, Mexico is projected to have per capita income growth over this period averaging just over 1.0 percent annually, less than a third of China’s pace. (I have used per capita GDP to adjust for the fact that Mexico still has a growing population whereas China’s is declining slightly. Per capita GDP is a better gauge of living standards.) If we are to believe that China’s economy is facing some sort of crisis, then what do we think about an economy that is growing at less than a third of its pace?
It is also worth noting that, by this purchasing power parity measure, China’s economy is already considerably larger than the U.S. economy. It was 22.0 percent larger last year (24.0 percent including Hong Kong.) With the more rapid projected growth rate, it will be 34.0 percent larger by 2028.
This gap is worth noting when thinking about how best to deal with China. Those who think we can spend the country into the ground with a major military buildup need to check their arithmetic. (The Soviet economy peaked at roughly 60 percent of the size of the U.S. economy.)
The U.S. has differences with China in many areas, but both countries will fare much better if they look for areas for cooperation, like healthcare and climate, rather than confrontation. President Biden seemed to acknowledge this in his State of the Union address. It will be good if he follows through.
Read More Leer más Join the discussion Participa en la discusión
This simple point was left out of a Washington Post article on the legal battle surrounding the Biden Administration’s efforts to negotiate lower prices for drugs purchased by Medicare. This point is important because the drug companies are definitely not trying to get the government out of the market, as the industry claims.
The industry is effectively insisting that the government is obligated to give it an unrestricted monopoly for the period of its patent duration. Also, since patent monopolies provide enormous incentives for corruption (they are equivalent to tariffs of many thousand percent, or even tens of thousands percent), drug companies often find ways to game the system and extend effective protection beyond the original patent life.
Anyhow, portraying this as a situation where the industry wants the free market and the Biden administration wants government intervention is 180 degrees at odds with reality. The industry wants very strong government intervention so that it can make big profits.
It’s also worth noting that the amount of money at stake here is potentially enormous. We will spend well over $600 billion this year on drugs. These drugs would likely cost less than $100 billion in a free market. The difference of $500 billion is more than eight times as large as President Biden’s requested funding for Ukraine.
Read More Leer más Join the discussion Participa en la discusión
Peter Coy used his column yesterday to beg President Biden not to use the term “greedflation” to explain the runup in inflation since the pandemic. I am sympathetic to much of his argument, most importantly, the idea that corporations suddenly turned greedy is a bit far out.
As Coy notes, corporations are always greedy. The real question is whether something unusual was going on with corporate profits in the pandemic. There clearly was an increase in profit margins in the pandemic. This was largely due to real shortages created by supply chain problems worldwide.
We can say this with a high degree of certainty because inflation was a worldwide story. This means that the idea that it was due to Biden’s “excessive” stimulus is silly.
While the U.S. is a huge part of the world economy, higher demand here could at most only explain a small fraction of the inflation in countries like the U.K. and Germany. The fact that their inflation has been similar to U.S. inflation since the pandemic, undermines the idea that Biden’s recovery package was the main factor in the U.S. inflation surge.
I have made this argument before and been told that people don’t care about inflation in the U.K. and Germany, they care about inflation here. That’s fine, but as an economist I’m trying to explain causation.
Any fool can look out over the horizon and see the earth is flat, the curvature of the planet is not generally visible in our range of vision. But we know the earth is in fact round, and no serious person is going to insist it is flat.
Similarly, we know inflation was a worldwide phenomenon due to the pandemic. If people want to yell at Biden over it, that is their right, but let’s not pretend that complaint is based in reality.
But let’s get back to “greedflation,” or “sellers’ inflation” the term used by Isabella Weber, the most prominent academic proponent of this view. There can be little doubt that there was a big shift to profits in the pandemic. Here’s the picture on the profit share of corporate income.
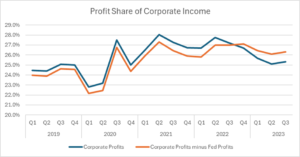
Source: Bureau of Economic Analysis and author’s calculations, see text.
It goes from just under 25.0 percent to a peak of 28.0 percent in the second quarter of 2021. (This calculation is corporate net operating surplus, NIPA Table 1.14, line 8, divided by employee compensation, line 4, plus line 8.) However, since that peak the profit share has shifted down somewhat to 25.7 percent in the third quarter of last year, the most recent quarter for which we have data. This implies that further rises in profit shares have not contributed to inflation in the last two and a half years, but we are still seeing a disproportionate share of national income going to profit. Corporations are still keeping more than a quarter of their pandemic windfall.
I have included a second line that shows a somewhat less optimistic picture from the standpoint of those who don’t want to see corporations pocket everything. This line subtracts out the profits reported by Federal Reserve Banks (NIPA Table 6.16D, Line 11). These profits are refunded to the Treasury and should not be viewed as part of corporate profits.
Making this subtraction gives a slightly different path of profits over the course of the pandemic. Profits go from 24.6 percent of income in the fourth quarter of 2019 to a peak of 27.3 percent in the second quarter of 2021. This implies a similar but somewhat smaller runup than what is shown without this adjustment.
But we get a very different picture on the other side. The Fed banks are now losing money (short story, they were nailed by the rise in interest rates). This means that their losses are now being subtracted from the profits earned by the corporate sector, causing the published number to be somewhat lower than is actually the case.
Using this adjustment, corporate profits stood at 26.3 percent of income in the most recent quarter. This implies that corporations are still pocketing more than 60 percent of their pandemic dividend.
This still raises the question of whether corporations were taking advantage of their market power to push up profit margins. Keep in mind, it would not be surprising that there is a shift to profits when we see short-term shortages, that is pretty much a textbook outcome. The question is whether there was something more going on due to the greater monopolization of the U.S. economy than in past decades.
I am still agnostic on this point, but I will note three issues.
First, it seems clear that in a context of general inflation, corporations are better able to jack up their prices beyond the increases in costs they actually see. When all prices are rising 7-8 percent, it seems easier to raise your own prices by this amount, or maybe even more, whether or not that reflects actual costs.
The second point is that the rise in margins seems to be surviving beyond the supply-chain crisis. Perhaps we will see further reductions in margins going forward, but supply chains were pretty much back to normal by the start of 2023, but we still see inflated margins. This suggests something other than supply chains was the cause or at least that the effect is enduring beyond the period of actual shortages.
The third point is that inflation was worldwide. I have not looked at profit margins in other countries (perhaps someone else has these data), but we generally think that Europe has been somewhat more aggressive in enforcing anti-trust rules than the U.S. If profit shares have increased everywhere by similar amounts, that would argue against the idea that the issue was excessive monopolization in the U.S.
In any case, the data are clear, corporations are taking a larger share of the pie now than before the pandemic. Go nail the bastards, President Biden!
Peter Coy used his column yesterday to beg President Biden not to use the term “greedflation” to explain the runup in inflation since the pandemic. I am sympathetic to much of his argument, most importantly, the idea that corporations suddenly turned greedy is a bit far out.
As Coy notes, corporations are always greedy. The real question is whether something unusual was going on with corporate profits in the pandemic. There clearly was an increase in profit margins in the pandemic. This was largely due to real shortages created by supply chain problems worldwide.
We can say this with a high degree of certainty because inflation was a worldwide story. This means that the idea that it was due to Biden’s “excessive” stimulus is silly.
While the U.S. is a huge part of the world economy, higher demand here could at most only explain a small fraction of the inflation in countries like the U.K. and Germany. The fact that their inflation has been similar to U.S. inflation since the pandemic, undermines the idea that Biden’s recovery package was the main factor in the U.S. inflation surge.
I have made this argument before and been told that people don’t care about inflation in the U.K. and Germany, they care about inflation here. That’s fine, but as an economist I’m trying to explain causation.
Any fool can look out over the horizon and see the earth is flat, the curvature of the planet is not generally visible in our range of vision. But we know the earth is in fact round, and no serious person is going to insist it is flat.
Similarly, we know inflation was a worldwide phenomenon due to the pandemic. If people want to yell at Biden over it, that is their right, but let’s not pretend that complaint is based in reality.
But let’s get back to “greedflation,” or “sellers’ inflation” the term used by Isabella Weber, the most prominent academic proponent of this view. There can be little doubt that there was a big shift to profits in the pandemic. Here’s the picture on the profit share of corporate income.
Source: Bureau of Economic Analysis and author’s calculations, see text.
It goes from just under 25.0 percent to a peak of 28.0 percent in the second quarter of 2021. (This calculation is corporate net operating surplus, NIPA Table 1.14, line 8, divided by employee compensation, line 4, plus line 8.) However, since that peak the profit share has shifted down somewhat to 25.7 percent in the third quarter of last year, the most recent quarter for which we have data. This implies that further rises in profit shares have not contributed to inflation in the last two and a half years, but we are still seeing a disproportionate share of national income going to profit. Corporations are still keeping more than a quarter of their pandemic windfall.
I have included a second line that shows a somewhat less optimistic picture from the standpoint of those who don’t want to see corporations pocket everything. This line subtracts out the profits reported by Federal Reserve Banks (NIPA Table 6.16D, Line 11). These profits are refunded to the Treasury and should not be viewed as part of corporate profits.
Making this subtraction gives a slightly different path of profits over the course of the pandemic. Profits go from 24.6 percent of income in the fourth quarter of 2019 to a peak of 27.3 percent in the second quarter of 2021. This implies a similar but somewhat smaller runup than what is shown without this adjustment.
But we get a very different picture on the other side. The Fed banks are now losing money (short story, they were nailed by the rise in interest rates). This means that their losses are now being subtracted from the profits earned by the corporate sector, causing the published number to be somewhat lower than is actually the case.
Using this adjustment, corporate profits stood at 26.3 percent of income in the most recent quarter. This implies that corporations are still pocketing more than 60 percent of their pandemic dividend.
This still raises the question of whether corporations were taking advantage of their market power to push up profit margins. Keep in mind, it would not be surprising that there is a shift to profits when we see short-term shortages, that is pretty much a textbook outcome. The question is whether there was something more going on due to the greater monopolization of the U.S. economy than in past decades.
I am still agnostic on this point, but I will note three issues.
First, it seems clear that in a context of general inflation, corporations are better able to jack up their prices beyond the increases in costs they actually see. When all prices are rising 7-8 percent, it seems easier to raise your own prices by this amount, or maybe even more, whether or not that reflects actual costs.
The second point is that the rise in margins seems to be surviving beyond the supply-chain crisis. Perhaps we will see further reductions in margins going forward, but supply chains were pretty much back to normal by the start of 2023, but we still see inflated margins. This suggests something other than supply chains was the cause or at least that the effect is enduring beyond the period of actual shortages.
The third point is that inflation was worldwide. I have not looked at profit margins in other countries (perhaps someone else has these data), but we generally think that Europe has been somewhat more aggressive in enforcing anti-trust rules than the U.S. If profit shares have increased everywhere by similar amounts, that would argue against the idea that the issue was excessive monopolization in the U.S.
In any case, the data are clear, corporations are taking a larger share of the pie now than before the pandemic. Go nail the bastards, President Biden!
Read More Leer más Join the discussion Participa en la discusión


