


The NYT had an interesting column today on the growing problem of drug shortages by Emily Tucker. The piece made several important points, but one of them could use a bit more attention.
Tucker notes that a resilient supply chain is not necessarily a domestic supply chain. This is exactly right, but the point deserves far more emphasis than it is given in this piece.
At the height of the pandemic there were shortages of a wide range of items, as demand increased and production was often curtailed due to pandemic conditions. This led to a call for increased domestic sourcing.
Some of this effort was badly misplaced, as stockpiling failings were often treated as supply chain issues. The lack of availability of masks and other protective gear was a stockpile problem, not a supply chain problem.
Even if all our masks were produced in Ohio, we could not get the hundreds of millions of masks needed at the start of the pandemic. It takes time to produce a huge number of masks and large volumes of protective gear more generally. These should have been stockpiled.
The fact that the country did not have a substantial stockpile at the start of the pandemic was a major failing of the Trump administration. This made it harder to curtail the spread of the disease and needlessly exposed many healthcare workers at a time when there were no vaccines or effective treatments.
Part of the problem with drugs in short supply is that many have limited markets. If a drug is designed to treat a relatively rare disease, there will not be an incentive for a company to have large amounts of backup capacity, or to spend a lot of money ensuring the quality of its manufacturing process, once it is available as a low-priced generic.
However, if the drug is being produced for a worldwide market, and not just the U.S. market, it is more likely that there will be several manufacturers producing any given drug. In that scenario, there will be a higher probability that one company’s output can be replaced by competitors, if it is forced to temporarily stop operating due to mechanical problems or quality control issues.
For this reason, it is important that we look to make the market as large as possible. This means removing barriers, other than necessary quality controls, to imports and encouraging other countries to do the same. In this story, a resilient supply chain is an international supply chain that encompasses as large a share of the world as possible. Restricting ourselves to domestic producers is the wrong way to go.
Read More Leer más Join the discussion Participa en la discusión
The reported saving rate has fallen sharply from its pandemic peaks, causing many commentators to speculate that people are running out of savings. At first glance, that is what the data show, with the saving rate for the most recent quarter coming in at 4.0 percent. That is up somewhat from the 3.3 percent rate of 2022, but down sharply from the double-digit rates of 2021, and well below the 7.0 percent plus rate we saw just before the pandemic. But there are some complicating factors that could change the picture.
National Income Versus Gross Domestic Product: The Mystery of the Statistical Discrepancy
In principle, we can measure gross domestic product on either the income side, adding up wages, rents, profits, and other forms of income or measure it on the output side, summing consumption, investment, government spending and net exports. We should get the same number either way, every dollar we spend buying things is income for someone.
As a practical matter, they never come out to be exactly the same, which is not surprising in a $27 trillion economy. The gap between the two is the statistical discrepancy. It usually is less than 1.0 percent of GDP in absolute value (it is positive if output exceeds income, negative when income is higher), but it can be larger, especially before the data are subject to comprehensive revisions over two or three years.
In recent quarters it has grown to be a large positive number, with measured output exceeding income by 2.5 percent of GDP ($688 billion). Most likely neither the income measure or output measure is exactly right, with the true number being somewhere in the middle. It is common to simply take the average of the two, with the idea that this is likely to be closer to the mark.
If we do this, we get that personal income is higher than the figure used to calculate the saving rate in the third quarter. (Saving is calculated as personal income, minus taxes and consumption.) I calculated an adjusted measure for personal income that assumes that the actual level of national income is equal to reported national income, plus half of the statistical discrepancy. (I adjusted for the small difference between personal income and national income by multiplying by the reported ratio for the two [NIPA Table 1.7.5, Line 25 divided by Line 16].)
I then calculated an adjusted saving rate, using this measure of adjusted personal income, instead of the reported measure of personal income. This came to 5.7 percent in the most recent quarter, as opposed to the 4.0 percent shown in the published data. This is shown in the figure below.
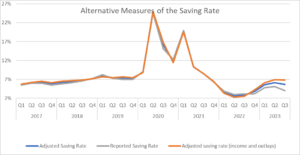
Source: Bureau of Economic Analysis and Author’s Calculations, see text.
However, if we think that the true measure of GDP lies halfway between the output side measure and the income side measure, then we should also adjust the output side of the calculation. This means that consumption will be somewhat lower than is reported. This will further increase the saving rate as shown in the adjusted saving rate line with both income and outlays adjusted.[1]
With this adjustment, the drop in the saving rate is largely eliminated. The saving rate in the third quarter, with both income and consumption adjusted, is 6.8 percent, higher than the averages for both 2017 and 2018. This implies that the widely touted drop in the saving rate in 2023 might just be a problem with measurement.
Taxes and Savings
There is one other point worth making about the saving rate. Savings are measured as income minus taxes. Taxes jumped in 2022. This was not because of an increase in the tax rate, it was due to the fact that people were paying capital gains taxes on stocks that they sold. Since capital gains do not count as income, selling stock at a profit and paying taxes on the gains, means households have lower disposable income.
This means, for example, if a household paid $2,000 in taxes on $10,000 in gains, its disposable income would be $2,000 lower in the year it sold the stock than in the prior year, even if its other income was exactly the same.
We can adjust for the impact of tax payments by simply taking savings (adjusted savings here), plus taxes, as a share of adjusted personal income. This is shown in the figure below.
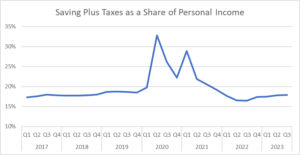
Source: Bureau of Economic Analysis and Author’s Calculations, see text.
As can be seen, there is a modest dip in this measure in the second half of 2022, but the most recent figure of 17.9 percent is above the 2017 and 2018 averages. By this measure also, it seems that the drop in the saving rate is just the result of measurement error.
[1] I multiplied reported outlays by 1 minus half the size of the statistical discrepancy (Table 2.1, Line 28 *(1-0.5*(Table 1.7.5 (Line 15/Line1).
The reported saving rate has fallen sharply from its pandemic peaks, causing many commentators to speculate that people are running out of savings. At first glance, that is what the data show, with the saving rate for the most recent quarter coming in at 4.0 percent. That is up somewhat from the 3.3 percent rate of 2022, but down sharply from the double-digit rates of 2021, and well below the 7.0 percent plus rate we saw just before the pandemic. But there are some complicating factors that could change the picture.
National Income Versus Gross Domestic Product: The Mystery of the Statistical Discrepancy
In principle, we can measure gross domestic product on either the income side, adding up wages, rents, profits, and other forms of income or measure it on the output side, summing consumption, investment, government spending and net exports. We should get the same number either way, every dollar we spend buying things is income for someone.
As a practical matter, they never come out to be exactly the same, which is not surprising in a $27 trillion economy. The gap between the two is the statistical discrepancy. It usually is less than 1.0 percent of GDP in absolute value (it is positive if output exceeds income, negative when income is higher), but it can be larger, especially before the data are subject to comprehensive revisions over two or three years.
In recent quarters it has grown to be a large positive number, with measured output exceeding income by 2.5 percent of GDP ($688 billion). Most likely neither the income measure or output measure is exactly right, with the true number being somewhere in the middle. It is common to simply take the average of the two, with the idea that this is likely to be closer to the mark.
If we do this, we get that personal income is higher than the figure used to calculate the saving rate in the third quarter. (Saving is calculated as personal income, minus taxes and consumption.) I calculated an adjusted measure for personal income that assumes that the actual level of national income is equal to reported national income, plus half of the statistical discrepancy. (I adjusted for the small difference between personal income and national income by multiplying by the reported ratio for the two [NIPA Table 1.7.5, Line 25 divided by Line 16].)
I then calculated an adjusted saving rate, using this measure of adjusted personal income, instead of the reported measure of personal income. This came to 5.7 percent in the most recent quarter, as opposed to the 4.0 percent shown in the published data. This is shown in the figure below.
Source: Bureau of Economic Analysis and Author’s Calculations, see text.
However, if we think that the true measure of GDP lies halfway between the output side measure and the income side measure, then we should also adjust the output side of the calculation. This means that consumption will be somewhat lower than is reported. This will further increase the saving rate as shown in the adjusted saving rate line with both income and outlays adjusted.[1]
With this adjustment, the drop in the saving rate is largely eliminated. The saving rate in the third quarter, with both income and consumption adjusted, is 6.8 percent, higher than the averages for both 2017 and 2018. This implies that the widely touted drop in the saving rate in 2023 might just be a problem with measurement.
Taxes and Savings
There is one other point worth making about the saving rate. Savings are measured as income minus taxes. Taxes jumped in 2022. This was not because of an increase in the tax rate, it was due to the fact that people were paying capital gains taxes on stocks that they sold. Since capital gains do not count as income, selling stock at a profit and paying taxes on the gains, means households have lower disposable income.
This means, for example, if a household paid $2,000 in taxes on $10,000 in gains, its disposable income would be $2,000 lower in the year it sold the stock than in the prior year, even if its other income was exactly the same.
We can adjust for the impact of tax payments by simply taking savings (adjusted savings here), plus taxes, as a share of adjusted personal income. This is shown in the figure below.
Source: Bureau of Economic Analysis and Author’s Calculations, see text.
As can be seen, there is a modest dip in this measure in the second half of 2022, but the most recent figure of 17.9 percent is above the 2017 and 2018 averages. By this measure also, it seems that the drop in the saving rate is just the result of measurement error.
[1] I multiplied reported outlays by 1 minus half the size of the statistical discrepancy (Table 2.1, Line 28 *(1-0.5*(Table 1.7.5 (Line 15/Line1).
Read More Leer más Join the discussion Participa en la discusión
The Washington Post ran a lengthy article about how Ava DuVernay is having her latest film financed by the Ford Foundation, as well as foundations supported by Melinda French Gates and Lauren Jobs. The piece describes the film, and notes how this can be a new model for financing artistic films that for-profit studios may not support:
“It’s a patronage model reminiscent of the charity bestowed on art museums or opera companies — high-cultural institutions that couldn’t survive without deep-pocketed benefactors.”
However, an important fact that did not get mentioned in the Post’s piece is that the charitable contributions made by the rich people who finance these foundations involve a large taxpayer subsidy.
While the size of the charitable contribution tax deduction has varied, depending on the tax rates at the time on incomes and estates, it has been roughly 40 percent. This means that taxpayers are picking up the tab for 40 cents of every dollar that these rich people choose to contribute to support Ms. DuVernay’s film. (To be clear, this is not at all a criticism of her new film. She is an accomplished filmmaker, and from the write-up in the article, it sounds like a very worthwhile project.)
The fact that the “patronage model” involves a large element of taxpayer subsidy seems an important point that might have been worth noting. While many of us may think it is a good idea for the government to support creative work and creative workers, we might not think that it’s best that the rich be the ones who decide which work deserves the taxpayers’ support.
A Democratic Alternative to the “Patronage” Model
Under the current system, the rich get the vast majority of the benefits from the charitable contribution tax deduction. This is both because they are taxed at a higher rate, so that $1 off of their taxable income saves them more money than $1 off the taxable income of a moderate or middle-income person, and also because the rich are far more likely to itemize their tax deductions.
Only 11.4 percent of taxpayers itemize their deductions, most of whom are at the top end of the income distribution. The overwhelming majority of taxpayers use the standard deduction. For them, the charitable contribution tax deduction is of no value whatsoever.
However, we could redesign this structure to make the benefits more evenly spread by changing the tax deduction to a credit. And, if we think it is important for the government to subsidize creative work, we could designate that this credit be used to support creative work.
The way this could work is that we would give every adult a credit of some size (say $100 to $200), which would be used to support the creative worker or organization that supports creative work, of their choosing. If we assume that every adult in the country could use their credit, this comes to between $25 billion and $50 billion a year, which would be a good chunk of change to support creative work.[1]
To be eligible to receive money through this system, a person or organization would register with the I.R.S., or a new agency, indicating what creative work they did. This registration would be similar to what non-profits do now to get tax-exempt status from the I.R.S.
They must say what they do that qualifies them for tax-exempt status; are they a church, a charity that provides food to the poor, or a think tank? The I.R.S. doesn’t make an effort to determine whether they are a good church, charity, or think tank, they just determine whether they do what they claim and if that would qualify them for tax-exempt status.
The same would be the case for individuals or organizations that register to be eligible for the creative work tax credit. They would indicate they are a writer, a movie producer, a singer, etc. Alternatively, an organization could register saying that they support blues musicians, mystery writers, or historical movies.
A condition of getting the money could be that the recipients are not eligible for copyright protection for a substantial period of time, say three to five years. The logic here is that the government gives people one subsidy for their work, not two. Copyright monopolies are one mechanism the government uses to support creative work. There is no reason that it should give people who benefit from this mechanism an additional subsidy in the form of money from a tax credit.
There is also the issue that the point of the credit is to support creative work for people to enjoy. If the work produced with the credit is paywalled and comes with a high price tag, not many people will see it. By contrast, if any work supported through this system is freely available over the web, it should attract the widest possible audience.
This copyright provision also has the benefit that it is largely self-enforcing. If someone who was getting money through the system tries to get a copyright during the period in which they are ineligible for copyright protection, their copyright is simply unenforceable. If a false copyright claimant attempts to bring a suit for copyright violation against someone, the person simply points out that the claimant was in the tax credit system and therefore their copyright is not valid.
The system for taxpayers using the credit would be similar to what is now in place for the charitable deduction. They could just indicate on their tax return that they had paid a certain amount to a qualified person or organization, with the understanding that they could be later asked for evidence that they had made this contribution.
Also, since the plan would be that everyone would have access to the credit, even if they did not pay income taxes, the system could be designed so that the government makes this payment directly on the taxpayer’s behalf. This would mean that they could fill out a form indicating which creative workers or organizations they wanted to support, and the government would make the payment.[2]
There obviously are many details that would need to be worked out in designing this sort of system, and there will undoubtedly be problems, but that is true with any system, including the current charitable contribution deduction. We could design the system to prevent obvious scams, for example, requiring that people get at least $3,000 in credit money, in order to be able to collect anything through the system, would prevent any sort of simple trading of credits. The key point is that we could design a government-funded system for supporting creative work that does not rely on the whims of the rich, as is now the case.
Journalism, a Special Case
The collapse of newspapers over the last quarter century, and especially local newspapers, has created interest in devising a system whereby the government supports this vital service. There have been various routes proposed, but there are efforts in at least two cities, Washington and Seattle, that have proposed this sort of individual credit or voucher system.
If one of these cities can get a news voucher system up and running, it would both do much to revitalize journalism in their community, and also provide a model for a more democratic system of taxpayer funding for creative work. The fact is, we do not need rich people to decide which creative work the government should support.
We should have a broader discussion on how taxpayer funding for the arts should be used. That would require some clearer thinking on this topic than what we see in public discussions today. It might also require some new ideas. We know the old saying that intellectuals have a hard time dealing with new ideas, but we need to have the discussion anyhow.
[1] I outline this sort of system in my book Rigged (it’s free).
[2] This route of direct payments might be preferable in a start-up phase where participation could be low. Suppose the credit was set at $100 a person, with the idea that if 250 million people took advantage of the credit, $25 billion would be paid out to creative workers. If the payments were made through a centralized system, and just a small number – say 25 million people – opted to use the credit, then the value of the credit could just be increased by a factor of ten. This would mean that each person who used their credit would effectively be contributing $1,000 to the creative workers/organizations of their choice.
The fact that the credits were initially far more valuable than originally intended should provide people with a strong incentive to participate in future years. In any case, this system would ensure that a substantial pot of money was available to support creative work.
Read More Leer más Join the discussion Participa en la discusión
The revisions to the third quarter growth data were striking. After an initial report showing GDP grew at a very strong 4.9 percent annual rate, the revised data show growth was actually somewhat faster at 5.2 percent.
No one expects the economy to sustain anything like this rate of growth going forward. Most likely the growth rate will fall back somewhere close to the 2.0 percent pace that is generally viewed as the sustainable rate, but many economists were projecting a recession this year. It’s clear the economy was not listening to these projections.
Most aspects of the economy look very good right now. Job growth is continuing at a healthy pace. Wage growth has moderated, but it is outpacing inflation. And, we are seeing an extraordinary boom in factory construction as a result of the Inflation Reduction Act and CHIPS Act, laying the basis for a future surge in manufacturing.
However, one aspect remains troubling. The profit share of national income rose sharply in the pandemic, and it continues to be elevated compared to pre-pandemic levels, which were already considerably higher than the profit shares at the start of the century.
We can argue about the cause of the rise in the profit share, but the fact that it has risen is not really in dispute. Here’s the picture since 2018.
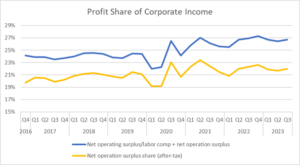
Source: Bureau of Economic Analysis and author’s calculations (see text).
These data are taken from the Bureau of Economic Analysis (BEA). There are always difficulties in measurement, and the shares will be revised when the BEA does comprehensive revisions next summer, but for now, these are the best data available.
The profit share jumped early in the pandemic recovery, going from an average of 24.1 percent of income in the corporate sector to 26.8 percent in the third quarter of 2020.[1] It peaked at 27.0 percent in the second quarter of 2022. The rise in profit shares is clearly what drove inflation, just as an accounting matter. It doesn’t make sense to say that wages are driving inflation if they are not even keeping pace with prices, which was true in most of 2022.
I had hoped that as the impact of the Covid pandemic lessened, and supply chains normalized, that we would see the profit share return to its pre-pandemic level. I was not alone in this hope, the Congressional Budget Office projected that profits would fall by 6.7 percent from fiscal year 2022 to fiscal year 2023.
That proved not to be the case. Instead, profits increased by 13.1 percent, and the profit share rose from 26.1 percent to 26.8 percent. This is both surprising and disturbing. It means that whatever factors allowed corporations to increase their profit margins during the pandemic were still allowing them to maintain elevated profit margins even as the impact of the pandemic subsided.
Again, the reasons for why profit margins have increased can be debated, but not the fact that they have increased. The Biden administration has been calling attention to this with recent comments by President Biden and other members of his administration.
While it’s not clear that his haranguing of corporations for excessive margins will affect their behavior, it is still worth calling attention to the issue. First, everyone should be clear (especially Jerome Powell and the Fed) that inflation is not a problem of excessive wage growth.
In fact, we should expect wage growth to exceed inflation by a larger than normal amount for a period of time to at least restore profit margins to their pre-pandemic level. It would not be unreasonable to think that we could get margins back to their 2000 level, but getting back to the pre-pandemic level would at least be a good start.
Second, workers should understand that they can demand higher pay because companies have the money. We saw this story clearly with the UAW strike. The Big Three automakers started with stingy offers, claiming that their backs were against the wall. The UAW held out and insisted that they get a decent contract restoring wage cuts they had accepted in hard times. This resulted in a contract where they got pay increases of close to 30 percent, with larger increases for lower-paid workers.
Third, it is important that the public be clear on the cause of the problem. They can blame or not blame politicians as they like, but what has changed over the last four years since the pandemic is that companies have increased their profit margins. It is understandable they would do this, corporations are in business to make a profit, but this is where the money went. We should all be clear on that fact.
Corporate Tax Rates Have Risen Sharply
While the high profit share can be seen as bad news, there is a positive part of the story that has not gotten the attention it deserves. For reasons that I don’t understand, the share of corporate profits going to pay taxes has risen under the Biden administration.
Trump cut the corporate tax rate from 35 percent to 21 percent in his 2017 tax cut. This led to a drop in the share of corporate profits going to taxes from around 18 percent to just over 13 percent. The share began to rise in the second half of 2021 and has averaged 17.7 percent over the last four quarters.
This is not obviously attributable to legislated increases in tax rates. There was a 1.0 percent tax on share buybacks included in the Inflation Reduction Act, which took effect at the start of this year. While this is great policy, it cannot plausibly explain much of the rise in corporate taxes over the last two years.
It is possible that greater enforcement has played an important role here. The Trump administration seemed to view tax evasion as a sport that was all fun and games. If a Biden I.R.S. decided that laws actually should be enforced, and taxes are not voluntary, that may have had a big impact on tax collections.
I’m sure there are people that have more insight into the causes of the increase in corporate tax payments, who can give a fuller picture. In any case, it is a big deal and the Biden administration deserves some serious credit here.
[1] This calculation takes the net operating surplus (Table 1.14, Line 8) minus the profits of Federal Reserve Banks (Table 6.16D, Line 11) over the combination of compensation of employees (Table 1.14, Line 4) plus net operating surplus. The after-tax line subtracts out taxes from this sum (Table 1.14, Line 12).
The revisions to the third quarter growth data were striking. After an initial report showing GDP grew at a very strong 4.9 percent annual rate, the revised data show growth was actually somewhat faster at 5.2 percent.
No one expects the economy to sustain anything like this rate of growth going forward. Most likely the growth rate will fall back somewhere close to the 2.0 percent pace that is generally viewed as the sustainable rate, but many economists were projecting a recession this year. It’s clear the economy was not listening to these projections.
Most aspects of the economy look very good right now. Job growth is continuing at a healthy pace. Wage growth has moderated, but it is outpacing inflation. And, we are seeing an extraordinary boom in factory construction as a result of the Inflation Reduction Act and CHIPS Act, laying the basis for a future surge in manufacturing.
However, one aspect remains troubling. The profit share of national income rose sharply in the pandemic, and it continues to be elevated compared to pre-pandemic levels, which were already considerably higher than the profit shares at the start of the century.
We can argue about the cause of the rise in the profit share, but the fact that it has risen is not really in dispute. Here’s the picture since 2018.
Source: Bureau of Economic Analysis and author’s calculations (see text).
These data are taken from the Bureau of Economic Analysis (BEA). There are always difficulties in measurement, and the shares will be revised when the BEA does comprehensive revisions next summer, but for now, these are the best data available.
The profit share jumped early in the pandemic recovery, going from an average of 24.1 percent of income in the corporate sector to 26.8 percent in the third quarter of 2020.[1] It peaked at 27.0 percent in the second quarter of 2022. The rise in profit shares is clearly what drove inflation, just as an accounting matter. It doesn’t make sense to say that wages are driving inflation if they are not even keeping pace with prices, which was true in most of 2022.
I had hoped that as the impact of the Covid pandemic lessened, and supply chains normalized, that we would see the profit share return to its pre-pandemic level. I was not alone in this hope, the Congressional Budget Office projected that profits would fall by 6.7 percent from fiscal year 2022 to fiscal year 2023.
That proved not to be the case. Instead, profits increased by 13.1 percent, and the profit share rose from 26.1 percent to 26.8 percent. This is both surprising and disturbing. It means that whatever factors allowed corporations to increase their profit margins during the pandemic were still allowing them to maintain elevated profit margins even as the impact of the pandemic subsided.
Again, the reasons for why profit margins have increased can be debated, but not the fact that they have increased. The Biden administration has been calling attention to this with recent comments by President Biden and other members of his administration.
While it’s not clear that his haranguing of corporations for excessive margins will affect their behavior, it is still worth calling attention to the issue. First, everyone should be clear (especially Jerome Powell and the Fed) that inflation is not a problem of excessive wage growth.
In fact, we should expect wage growth to exceed inflation by a larger than normal amount for a period of time to at least restore profit margins to their pre-pandemic level. It would not be unreasonable to think that we could get margins back to their 2000 level, but getting back to the pre-pandemic level would at least be a good start.
Second, workers should understand that they can demand higher pay because companies have the money. We saw this story clearly with the UAW strike. The Big Three automakers started with stingy offers, claiming that their backs were against the wall. The UAW held out and insisted that they get a decent contract restoring wage cuts they had accepted in hard times. This resulted in a contract where they got pay increases of close to 30 percent, with larger increases for lower-paid workers.
Third, it is important that the public be clear on the cause of the problem. They can blame or not blame politicians as they like, but what has changed over the last four years since the pandemic is that companies have increased their profit margins. It is understandable they would do this, corporations are in business to make a profit, but this is where the money went. We should all be clear on that fact.
Corporate Tax Rates Have Risen Sharply
While the high profit share can be seen as bad news, there is a positive part of the story that has not gotten the attention it deserves. For reasons that I don’t understand, the share of corporate profits going to pay taxes has risen under the Biden administration.
Trump cut the corporate tax rate from 35 percent to 21 percent in his 2017 tax cut. This led to a drop in the share of corporate profits going to taxes from around 18 percent to just over 13 percent. The share began to rise in the second half of 2021 and has averaged 17.7 percent over the last four quarters.
This is not obviously attributable to legislated increases in tax rates. There was a 1.0 percent tax on share buybacks included in the Inflation Reduction Act, which took effect at the start of this year. While this is great policy, it cannot plausibly explain much of the rise in corporate taxes over the last two years.
It is possible that greater enforcement has played an important role here. The Trump administration seemed to view tax evasion as a sport that was all fun and games. If a Biden I.R.S. decided that laws actually should be enforced, and taxes are not voluntary, that may have had a big impact on tax collections.
I’m sure there are people that have more insight into the causes of the increase in corporate tax payments, who can give a fuller picture. In any case, it is a big deal and the Biden administration deserves some serious credit here.
[1] This calculation takes the net operating surplus (Table 1.14, Line 8) minus the profits of Federal Reserve Banks (Table 6.16D, Line 11) over the combination of compensation of employees (Table 1.14, Line 4) plus net operating surplus. The after-tax line subtracts out taxes from this sum (Table 1.14, Line 12).
Read More Leer más Join the discussion Participa en la discusión
All the normal economic data tell us that people should feel pretty good about the economy right now. Unemployment has been below 4.0 percent for 21 consecutive months for the first time in more than half a century.
Tens of millions of people have left jobs they didn’t like to find better ones. As a result, workplace satisfaction is at the highest level it has been in the nearly forty years the Conference Board has done its survey.
The recent jump in mortgage rates has made it difficult for first-time home buyers, but homeownership rates are still well above pre-pandemic levels overall and for young people, Blacks and Hispanics, and people with below the median income.
The number of workers who can work from home, saving themselves thousands a year in commuting costs and hundreds of hours of time spent commuting, has increased by roughly 11 million.
Fifteen million households have been able to refinance their mortgages and save themselves thousands of dollars a year on interest payments.
And, real wages are above pre-pandemic levels, as wage growth has outpaced inflation. With inflation slowing, this pattern should continue. The biggest wage gains were for those at the bottom of the wage distribution.
All of these factors suggest that people should be feeling pretty good about the economy right now, but polls consistently show that people think the economy is doing terribly. Those of us who point to the data are told that we can’t argue with people’s lived experience, people feel what they feel.
That’s fair enough, except I want to know how people’s lived experience can tell them that their local economy is doing okay, it’s only the national economy that is in the tank?
A recent poll by Bloomberg found that 49 percent of respondents said their local economy is on the right track. Now that’s not great, but pretty damn close to half.
By contrast, only 26 percent said that the national economy was on the right track. This means that 23 percent of the people answering the poll thought things were going well where they lived, but were bad in the rest of the country.
My question then is, how this 23 percent could, based on their lived experience, determine that things were worse where they didn’t live than where they did live?
My working hypothesis is that they are likely reflecting the media’s endless trash-talking of the economy. The problem is not just Fox, which sees its purpose as advancing the Republican agenda, but also CNN, the NYT, the WaPo, and other major news outlets. Stories about inflation and prices not falling (they never do) fill their pages.
Stories about record-low unemployment are few and far between, and pieces on workplace satisfaction, the surge in mortgage refinancing and interest savings, and explosion in work-from-home are virtually none existent.
In my working hypothesis, when people tell us the national economy is bad, they are not reporting on their lived experience, they are repeating what they have heard directly or indirectly from the media. Everyone knows the economy is bad, they don’t want to look stupid so they give what they have been told is the correct answer.
I am open to other explanations for how 23 percent of the people think their local economy is on the right track, but the national economy is not.
Read More Leer más Join the discussion Participa en la discusión
Like many self-imagined “free-traders,” the Washington Post editorial board cannot even conceive of free trade when it comes to prescription drugs. They demonstrated this fact yet again in discussing ways to deal with the high price of effective weight-loss drugs like Wegovy. These drugs carry price tags of more than $1,000 a month, making them costly for insurers, governments, or individuals who have to pick up the tab themselves.
The Post throws out a couple of ideas that could allow for a lower price, but never considers the fact that these drugs would be cheap without the government-granted patent monopolies that prevent generic manufacturers from entering the market. The monopolies are of course to provide an incentive to undertake the research, but there are other mechanisms for providing incentives, like paying people.
We did this when we wanted Moderna to develop a Covid vaccine, paying the company almost a billion dollars to develop and then test the vaccine. In the standard for our government, we then gave Moderna control over the vaccine, creating at least five Moderna billionaires. (Tell me again how conservatives want less government.) If we adopted the policy of only paying for research once, we would have both had the vaccine and low prices, since it likely could be manufactured and distributed for around $4 or $5 a shot.
In the case of Wegovy and other weight loss drugs, it’s likely the case that we would be talking about a cost of $20 or $30 a month in the absence of the patent monopoly. In this case, the monopoly is raising the price by a factor of 30 or 40, the equivalent of a tariff of 3,000 or 4,000 percent.
While the WaPo would usually go on the warpath over a tariff of 10 or 25 percent, it is apparently just fine with this much larger tariff that keeps drug prices high. Needless to say, we would not be debating how to cover the cost if Wegovy was selling for $30 for a month’s dosage.
We should also recognize this is real money. We will spend over $600 billion this year (almost $5,000 per family) on drugs that would likely cost less than $100 billion in a free market. This dwarfs the money at stake in tariffs on items like cars or steel, but it goes unmentioned at the Washington Post and in polite circles more generally.
In addition to lower prices, there is a second very important reason we should want free trade in prescription drugs. As the Post mentions, there are serious questions about the long-term side effects of Wegovy and other weight-loss drugs.
It would be good to have honest assessments of these side effects. While the researchers doing studies of these side effects may all be doing credible research, it is likely that there will be some ambiguities in the results. The billions of dollars on the table, in the form of prospective profits, puts a very big thumb on the scale towards minimizing negative side effects.
We would likely get a more honest scientific debate, and better outcomes for patients, if there wasn’t so much money on one side of this issue. For that reason also, we should want to see a free market for weight-loss drugs and drugs more generally.
Read More Leer más Join the discussion Participa en la discusión
As a Thanksgiving present to readers, Washington Post columnist Catherine Rampell decided to tell us again how old-timers are robbing from our children with their generous Social Security and Medicare benefits. This is always a popular theme at the WaPo, especially around the holiday season.
The story is infuriating for four reasons:
Social Security
The Social Security program has always been reasonably well-funded, even as slower growth and the upward redistribution of income over the last five decades have hurt the program’s finances. It is now projected to face a shortfall in a bit over a decade, but the gap between scheduled benefits and taxes is not exceptionally large, as calculated by Gene Steurele and Karen Smith, Rampell’s source.
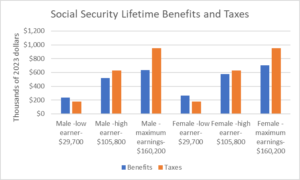
Source: Steurele and Smith, 2023.
The chart below above shows Steurele and Smith’s calculations for lifetime Social Security benefits and taxes, for people turning 65 in 2025, for men and women at different earnings levels. There are a few points worth noting on these calculations.
First, they are highly stylized, assuming that a worker puts in 43 years from age 22 to age 65 always earning the same wage relative to the overall average. This means that their wage rises year by year in step with inflation and the increase in average wages. No one actually would follow this pattern.
They are likely to earn less early in their career and more later in their career. They also are likely to have some years of little or no earnings. This is especially the case for women who are likely to spend some time outside of the paid labor force caring for children or parents. These adjustments would generally lead to higher benefits relative to taxes.
The second point is that the calculations assume that everyone lives to age 65 at which point they start to collect benefits. Some people will die before they can collect benefits, so we are looking at the benefits for workers who survive to collect benefits. (Social Security also has survivors’ benefits that go to spouses and minor children of deceased workers, so their tax payments are not necessarily a complete loss.)
The third point is that Steurele and Smith have opted to use a 2.0 percent real (inflation-adjusted) interest rate to discount taxes and benefits. This is a standard rate to use in this sort of analysis, but one could argue for a higher or lower rate. A higher rate would make the program seem less generous, while a lower rate would raise benefits relative to taxes.
As can be seen, low earners are projected to receive more in benefits than they pay in taxes. An important qualification here is that there is a large and growing gap in life expectancies between low and higher earners. These calculations assume that everyone of the same gender has the same life expectancy regardless of their income. This means that the benefits will be somewhat overstated for low earners and understated for high earners.
Ignoring the life expectancy issue, the chart shows that projected benefits end up being less than taxes once we get to high earners ($105,800 in 2023). For men projected lifetime taxes exceed benefits by $106,000. For women the gap is smaller at $49,000, reflecting their longer life expectancy.
Moving to maximum earners, people who earn the income at which the payroll tax is capped ($160,200 in 2023), the gaps become larger. In the case of men, projected lifetime taxes exceed benefits by $319,000. For women, projected lifetime taxes are $249,000 more than benefits.
There are some simple takeaways we can get from the Steurele and Smith analysis. First, for low and middle-wage earners Social Security does indeed pay out more in benefits than workers pay in taxes. However, the gap is not very large. For average earners, who got $66,100 in 2023, (not shown to keep the size of the graph manageable), the gap is $3,000 for men and $46,000 for women.
For higher income earners taxes actually exceed benefits. In the case of maximum earners, these excess payments are actually fairly large, as noted $319,000 for men and $249,000 for women.
This raises an interesting issue, if we are looking to cut benefits to reduce the “subsidy” to the elderly provided by Social Security. We can cut back benefits by a substantial percentage for low earners to bring their lifetime benefits more closely in line with their lifetime taxes, but do we really want to reduce retirement benefits for people who had average earnings of $29,700?
We can make some cuts for more middle-income workers, but someone earning $66,100 during their working lifetime was not terribly comfortable, and there is not much subsidy here to start, especially with men. When we get to higher earners, taxes already exceed benefits. We can still make cuts to their benefits, but we would not be taking back a subsidy by this calculation, we would be increasing their net overpayment to the program.
It’s also worth noting who is a high earner in this story. The high earner had annual earnings of $105,800 in 2023. President Biden promised that he would not raise taxes on couples earning less than $400,000. That puts his cutoff of $200,000 at almost twice the high earner level, and the calculation of lifetime benefits and taxes turns negative at a considerably lower income than the stylized high earner.
These calculations show that if we just take Social Security in isolation and want to reduce the subsidy implied here we either have to cut benefits for people who are not living comfortably by most standards, or we have to cut benefits for people who are not currently receiving a subsidy. We may decide that the latter is good policy, but we should be clear that it is not taking back a subsidy.
There is an important qualification to this discussion. Married couples will generally do better in these calculations than single workers. This is because the spousal benefit allows the spouse to collect the greater of their own benefit or half of their spouse’s benefit. Also, a surviving spouse will receive the greater of their own or their deceased spouse’s benefit. For these reasons, lifetime benefits for couples will generally be higher relative to taxes than for single individuals.
The Medicare Subsidy and the Broken Healthcare System Story
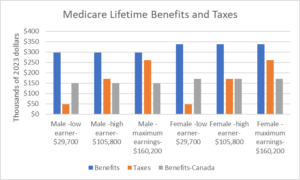
The Steurele and Smith analysis shows much larger subsidies for the Medicare program, as shown below.
There are a few qualifications to these calculations that should be noted. First, the same caveats about earnings patterns that were noted with the Social Security calculations also apply to the projected value of Medicare taxes.
Second, the differences in life expectancies by income matter here also when assessing the size of the tax penalty or subsidy. The program is less generous for low earners than shown in this figure and more generous for high earners.
The third point is that, unlike with the designated Social Security tax, the Medicare tax is not capped. This means that people earning above the Social Security cap will be paying more taxes to support the program. For very high earners ($185,000 for men and $207,000 for women), projected taxes would exceed benefits. The size of the tax penalty increases further up the income scale.
Finally, high-income people also pay a designated Medicare tax on capital income, like dividends and capital gains. For these people, it is virtually guaranteed that their Medicare taxes exceed their projected benefits.
With these caveats, we see the same general story as with Social Security, where there is more of a subsidy for lower earners than higher earners. While the overall gaps are larger for Medicare, projected benefits exceed taxes by a larger amount, this changes less with income than in the case of Social Security.
This is due to the fact that, unlike Social Security, the payout is not designed to be progressive, with all retirees getting in principle the same benefit.[1] This is qualified by the fact that higher-income retirees can expect to receive benefits for a considerably longer period of time, making the benefit regressive.
I have added a third bar to this graph, labeled “Benefits-Canada.” This is a calculation of what the cost of benefits would be if we paid the same amount per person for our healthcare as Canada does. The Medicare program appears as a huge subsidy to beneficiaries primarily because we pay so much more for our health care than people in other wealthy countries.
According to the OECD, we pay 57 percent more per person than Germany, 107 percent more than France, and 99 percent more than Canada. This sort of massive gap can be shown with U.S. costs relative to every other wealthy country. We don’t get any obvious benefit in terms of better healthcare outcomes from this additional spending. Life expectancy in the United States is considerably shorter than in most other wealthy countries.
The “Benefits-Canada” bar allows us to assess the value of Medicare benefits if our healthcare costs were more in line with those in other countries. It multiplies the projected value of Medicare benefits by the ratio of per person health care costs in Canada to costs in the United States (50.3 percent).
As can be seen, if we calculate Medicare benefits assuming that we pay as much for our health care as people in Canada, most of the calculated subsidy goes away. Low earners still receive a substantial subsidy, $102,000 for men and $122,000 for women, but this quickly goes away higher up the income ladder.
If we assume Canadian health care costs, a high-earning male has a net Medicare tax penalty of $21,000, while a high-earning woman has a net tax penalty of just under $1,000. For those earning at the Social Security maximum, the net tax penalty for men is $111,000, and for women it’s $91,000.
The implication of this calculation is that the seemingly large subsidies that Medicare provides to retirees is not due to the generosity of benefits, it is due to the fact that we overpay for our healthcare. Medicare is not providing a large subsidy to retirees, it is providing a large subsidy for drug companies, medical equipment suppliers, insurers, and doctors. (In case you are wondering, people in the U.S. are not generally paid much more than people in other wealthy countries. Our manufacturing workers get considerably lower pay.)
We pay roughly twice as much in all of these categories as people in other wealthy countries. It is misleading to imply that these overpayments are generous to retirees. While all of these interest groups have powerful lobbies, which makes it politically difficult to bring their compensation in line with other wealthy countries, we should at least be honest about who is getting subsidized by the high cost of our Medicare program.
What Do Subsidies Mean, When the Government Structures the Market?
There is another aspect of these calculations that should have jumped out at people when I noted that the designated Medicare tax is not capped and also applies to capital income. The taxes that are designated for these programs are arbitrary. We can designate other taxes that people pay as being Social Security and Medicare taxes, and apparent subsidies will disappear.
In fact, the idea that we can make a clear distinction between income that people have somehow earned, and income that is given to them by the government, is in fact an illusion. The government structures the markets in ways that allow some people to get very wealthy and keep others on the edge of subsistence.
Those who make big bucks in the healthcare industry are just one example. While our trade policy was quite explicitly designed to open the door to cheap manufactured goods, we actually have increased the barriers that make it difficult for foreign-trained doctors to practice in the United States.
We have made patent and copyright monopolies longer and stronger. The government subsidizes bio-medical research and then gives private companies monopoly control over the product. In a recent example, we paid Moderna to develop a COVID vaccine and then gave them control over it, creating at least five Moderna billionaires.
We have allowed our financial sector to become incredibly bloated, creating many millionaires and billionaires, even as we demand efficiency elsewhere. We give Elon Musk and Mark Zuckerberg Section 230 protection against defamation suits that their counterparts in print and broadcast media do not enjoy.
And, as was recently highlighted with the UAW strike, our CEOs make far more than the CEOS of comparably sized companies in other wealthy countries. The difference is as much as a factor of ten in the case of Japanese companies. This is not due to the natural workings of the market, this is the result of a corrupt corporate governance structure that allows the CEOs to have their friends set their pay.
Yes, I am again talking about my book (it’s free). It is absurd to obsess about tax and transfer policy while ignoring the ways in which the government structures the market to determine winners and losers. It is understandable that the right would like tax and transfer policy to be the focus of public debate, since the default is a market outcome that leaves most money with the rich.
However, it is beyond absurd that people who consider themselves progressive would accept this framing. We can structure the market differently to get more equitable market outcomes. This should be front and center in public debate. Unfortunately, the right wants to hide the fact that we can structure the market differently, and progressives are all too willing to go along.
Future of the Planet
There is a final point on the sort of generational scorecard implied by these calculations of Social Security and Medicare benefits. We don’t just hand our children a tax bill, we hand them an entire economy, society, and planet.
If we experience anything resembling normal economic growth, average wages will be far higher twenty or thirty years from now than they are today. Will the typical worker see these wage gains? That will depend on distribution within generations, not between generations.
We also see costs from items like the military. When I was growing up in the 1960s we paid a much larger share of our GDP to support the Cold War. (Young men were also drafted.) We will again pay lots more money for the military if we have a new Cold War with China. The implied taxes don’t figure into the Social Security and Medicare calculations, but will be every bit as much of a drain on the income of people in the future as taxes for these programs.
And, we should always have global warming front and center. If we paid off the national debt and eliminated the programs to support retirees, but did nothing to restrain global warming, our children and grandchildren would not have much reason to thank us. First and foremost, we must give them a livable planet.
Phony Answers to a Phony Question
The whole subsidy to retiree story is a diversion from the many important issues facing the country. Even the core idea, that we don’t adequately support the young because we give too much to the elderly is wrong.
We saw this very clearly in the debate over the extension of the child tax credit. As with everything in Congress, much is determined by narrow political considerations. Republicans had no interest in giving President Biden and the Democrats a win, but the bill could have passed without Republican votes.
The deciding factor was the refusal of West Virginia Senator Joe Manchin to support the bill. Senator Manchin was very clear on his concerns. He didn’t argue that we were spending too much on retirees, he didn’t want low-income people to have the money.
This is in general the story as to why we don’t have adequate funding for early childhood education, children’s nutrition, day care and other programs that would benefit children. There is a substantial political bloc that does not want to fund these programs. And, they still would not want to fund these programs even if we didn’t pay a dime for Social Security and Medicare.
[1] This is not strictly true, since the premium payment that retirees make for Part B and Part D of the Medicare program depends on income in retirement.
As a Thanksgiving present to readers, Washington Post columnist Catherine Rampell decided to tell us again how old-timers are robbing from our children with their generous Social Security and Medicare benefits. This is always a popular theme at the WaPo, especially around the holiday season.
The story is infuriating for four reasons:
Social Security
The Social Security program has always been reasonably well-funded, even as slower growth and the upward redistribution of income over the last five decades have hurt the program’s finances. It is now projected to face a shortfall in a bit over a decade, but the gap between scheduled benefits and taxes is not exceptionally large, as calculated by Gene Steurele and Karen Smith, Rampell’s source.
Source: Steurele and Smith, 2023.
The chart below above shows Steurele and Smith’s calculations for lifetime Social Security benefits and taxes, for people turning 65 in 2025, for men and women at different earnings levels. There are a few points worth noting on these calculations.
First, they are highly stylized, assuming that a worker puts in 43 years from age 22 to age 65 always earning the same wage relative to the overall average. This means that their wage rises year by year in step with inflation and the increase in average wages. No one actually would follow this pattern.
They are likely to earn less early in their career and more later in their career. They also are likely to have some years of little or no earnings. This is especially the case for women who are likely to spend some time outside of the paid labor force caring for children or parents. These adjustments would generally lead to higher benefits relative to taxes.
The second point is that the calculations assume that everyone lives to age 65 at which point they start to collect benefits. Some people will die before they can collect benefits, so we are looking at the benefits for workers who survive to collect benefits. (Social Security also has survivors’ benefits that go to spouses and minor children of deceased workers, so their tax payments are not necessarily a complete loss.)
The third point is that Steurele and Smith have opted to use a 2.0 percent real (inflation-adjusted) interest rate to discount taxes and benefits. This is a standard rate to use in this sort of analysis, but one could argue for a higher or lower rate. A higher rate would make the program seem less generous, while a lower rate would raise benefits relative to taxes.
As can be seen, low earners are projected to receive more in benefits than they pay in taxes. An important qualification here is that there is a large and growing gap in life expectancies between low and higher earners. These calculations assume that everyone of the same gender has the same life expectancy regardless of their income. This means that the benefits will be somewhat overstated for low earners and understated for high earners.
Ignoring the life expectancy issue, the chart shows that projected benefits end up being less than taxes once we get to high earners ($105,800 in 2023). For men projected lifetime taxes exceed benefits by $106,000. For women the gap is smaller at $49,000, reflecting their longer life expectancy.
Moving to maximum earners, people who earn the income at which the payroll tax is capped ($160,200 in 2023), the gaps become larger. In the case of men, projected lifetime taxes exceed benefits by $319,000. For women, projected lifetime taxes are $249,000 more than benefits.
There are some simple takeaways we can get from the Steurele and Smith analysis. First, for low and middle-wage earners Social Security does indeed pay out more in benefits than workers pay in taxes. However, the gap is not very large. For average earners, who got $66,100 in 2023, (not shown to keep the size of the graph manageable), the gap is $3,000 for men and $46,000 for women.
For higher income earners taxes actually exceed benefits. In the case of maximum earners, these excess payments are actually fairly large, as noted $319,000 for men and $249,000 for women.
This raises an interesting issue, if we are looking to cut benefits to reduce the “subsidy” to the elderly provided by Social Security. We can cut back benefits by a substantial percentage for low earners to bring their lifetime benefits more closely in line with their lifetime taxes, but do we really want to reduce retirement benefits for people who had average earnings of $29,700?
We can make some cuts for more middle-income workers, but someone earning $66,100 during their working lifetime was not terribly comfortable, and there is not much subsidy here to start, especially with men. When we get to higher earners, taxes already exceed benefits. We can still make cuts to their benefits, but we would not be taking back a subsidy by this calculation, we would be increasing their net overpayment to the program.
It’s also worth noting who is a high earner in this story. The high earner had annual earnings of $105,800 in 2023. President Biden promised that he would not raise taxes on couples earning less than $400,000. That puts his cutoff of $200,000 at almost twice the high earner level, and the calculation of lifetime benefits and taxes turns negative at a considerably lower income than the stylized high earner.
These calculations show that if we just take Social Security in isolation and want to reduce the subsidy implied here we either have to cut benefits for people who are not living comfortably by most standards, or we have to cut benefits for people who are not currently receiving a subsidy. We may decide that the latter is good policy, but we should be clear that it is not taking back a subsidy.
There is an important qualification to this discussion. Married couples will generally do better in these calculations than single workers. This is because the spousal benefit allows the spouse to collect the greater of their own benefit or half of their spouse’s benefit. Also, a surviving spouse will receive the greater of their own or their deceased spouse’s benefit. For these reasons, lifetime benefits for couples will generally be higher relative to taxes than for single individuals.
The Medicare Subsidy and the Broken Healthcare System Story
The Steurele and Smith analysis shows much larger subsidies for the Medicare program, as shown below.
There are a few qualifications to these calculations that should be noted. First, the same caveats about earnings patterns that were noted with the Social Security calculations also apply to the projected value of Medicare taxes.
Second, the differences in life expectancies by income matter here also when assessing the size of the tax penalty or subsidy. The program is less generous for low earners than shown in this figure and more generous for high earners.
The third point is that, unlike with the designated Social Security tax, the Medicare tax is not capped. This means that people earning above the Social Security cap will be paying more taxes to support the program. For very high earners ($185,000 for men and $207,000 for women), projected taxes would exceed benefits. The size of the tax penalty increases further up the income scale.
Finally, high-income people also pay a designated Medicare tax on capital income, like dividends and capital gains. For these people, it is virtually guaranteed that their Medicare taxes exceed their projected benefits.
With these caveats, we see the same general story as with Social Security, where there is more of a subsidy for lower earners than higher earners. While the overall gaps are larger for Medicare, projected benefits exceed taxes by a larger amount, this changes less with income than in the case of Social Security.
This is due to the fact that, unlike Social Security, the payout is not designed to be progressive, with all retirees getting in principle the same benefit.[1] This is qualified by the fact that higher-income retirees can expect to receive benefits for a considerably longer period of time, making the benefit regressive.
I have added a third bar to this graph, labeled “Benefits-Canada.” This is a calculation of what the cost of benefits would be if we paid the same amount per person for our healthcare as Canada does. The Medicare program appears as a huge subsidy to beneficiaries primarily because we pay so much more for our health care than people in other wealthy countries.
According to the OECD, we pay 57 percent more per person than Germany, 107 percent more than France, and 99 percent more than Canada. This sort of massive gap can be shown with U.S. costs relative to every other wealthy country. We don’t get any obvious benefit in terms of better healthcare outcomes from this additional spending. Life expectancy in the United States is considerably shorter than in most other wealthy countries.
The “Benefits-Canada” bar allows us to assess the value of Medicare benefits if our healthcare costs were more in line with those in other countries. It multiplies the projected value of Medicare benefits by the ratio of per person health care costs in Canada to costs in the United States (50.3 percent).
As can be seen, if we calculate Medicare benefits assuming that we pay as much for our health care as people in Canada, most of the calculated subsidy goes away. Low earners still receive a substantial subsidy, $102,000 for men and $122,000 for women, but this quickly goes away higher up the income ladder.
If we assume Canadian health care costs, a high-earning male has a net Medicare tax penalty of $21,000, while a high-earning woman has a net tax penalty of just under $1,000. For those earning at the Social Security maximum, the net tax penalty for men is $111,000, and for women it’s $91,000.
The implication of this calculation is that the seemingly large subsidies that Medicare provides to retirees is not due to the generosity of benefits, it is due to the fact that we overpay for our healthcare. Medicare is not providing a large subsidy to retirees, it is providing a large subsidy for drug companies, medical equipment suppliers, insurers, and doctors. (In case you are wondering, people in the U.S. are not generally paid much more than people in other wealthy countries. Our manufacturing workers get considerably lower pay.)
We pay roughly twice as much in all of these categories as people in other wealthy countries. It is misleading to imply that these overpayments are generous to retirees. While all of these interest groups have powerful lobbies, which makes it politically difficult to bring their compensation in line with other wealthy countries, we should at least be honest about who is getting subsidized by the high cost of our Medicare program.
What Do Subsidies Mean, When the Government Structures the Market?
There is another aspect of these calculations that should have jumped out at people when I noted that the designated Medicare tax is not capped and also applies to capital income. The taxes that are designated for these programs are arbitrary. We can designate other taxes that people pay as being Social Security and Medicare taxes, and apparent subsidies will disappear.
In fact, the idea that we can make a clear distinction between income that people have somehow earned, and income that is given to them by the government, is in fact an illusion. The government structures the markets in ways that allow some people to get very wealthy and keep others on the edge of subsistence.
Those who make big bucks in the healthcare industry are just one example. While our trade policy was quite explicitly designed to open the door to cheap manufactured goods, we actually have increased the barriers that make it difficult for foreign-trained doctors to practice in the United States.
We have made patent and copyright monopolies longer and stronger. The government subsidizes bio-medical research and then gives private companies monopoly control over the product. In a recent example, we paid Moderna to develop a COVID vaccine and then gave them control over it, creating at least five Moderna billionaires.
We have allowed our financial sector to become incredibly bloated, creating many millionaires and billionaires, even as we demand efficiency elsewhere. We give Elon Musk and Mark Zuckerberg Section 230 protection against defamation suits that their counterparts in print and broadcast media do not enjoy.
And, as was recently highlighted with the UAW strike, our CEOs make far more than the CEOS of comparably sized companies in other wealthy countries. The difference is as much as a factor of ten in the case of Japanese companies. This is not due to the natural workings of the market, this is the result of a corrupt corporate governance structure that allows the CEOs to have their friends set their pay.
Yes, I am again talking about my book (it’s free). It is absurd to obsess about tax and transfer policy while ignoring the ways in which the government structures the market to determine winners and losers. It is understandable that the right would like tax and transfer policy to be the focus of public debate, since the default is a market outcome that leaves most money with the rich.
However, it is beyond absurd that people who consider themselves progressive would accept this framing. We can structure the market differently to get more equitable market outcomes. This should be front and center in public debate. Unfortunately, the right wants to hide the fact that we can structure the market differently, and progressives are all too willing to go along.
Future of the Planet
There is a final point on the sort of generational scorecard implied by these calculations of Social Security and Medicare benefits. We don’t just hand our children a tax bill, we hand them an entire economy, society, and planet.
If we experience anything resembling normal economic growth, average wages will be far higher twenty or thirty years from now than they are today. Will the typical worker see these wage gains? That will depend on distribution within generations, not between generations.
We also see costs from items like the military. When I was growing up in the 1960s we paid a much larger share of our GDP to support the Cold War. (Young men were also drafted.) We will again pay lots more money for the military if we have a new Cold War with China. The implied taxes don’t figure into the Social Security and Medicare calculations, but will be every bit as much of a drain on the income of people in the future as taxes for these programs.
And, we should always have global warming front and center. If we paid off the national debt and eliminated the programs to support retirees, but did nothing to restrain global warming, our children and grandchildren would not have much reason to thank us. First and foremost, we must give them a livable planet.
Phony Answers to a Phony Question
The whole subsidy to retiree story is a diversion from the many important issues facing the country. Even the core idea, that we don’t adequately support the young because we give too much to the elderly is wrong.
We saw this very clearly in the debate over the extension of the child tax credit. As with everything in Congress, much is determined by narrow political considerations. Republicans had no interest in giving President Biden and the Democrats a win, but the bill could have passed without Republican votes.
The deciding factor was the refusal of West Virginia Senator Joe Manchin to support the bill. Senator Manchin was very clear on his concerns. He didn’t argue that we were spending too much on retirees, he didn’t want low-income people to have the money.
This is in general the story as to why we don’t have adequate funding for early childhood education, children’s nutrition, day care and other programs that would benefit children. There is a substantial political bloc that does not want to fund these programs. And, they still would not want to fund these programs even if we didn’t pay a dime for Social Security and Medicare.
[1] This is not strictly true, since the premium payment that retirees make for Part B and Part D of the Medicare program depends on income in retirement.
Read More Leer más Join the discussion Participa en la discusión
Eduardo Porter had an interesting column in the Washington Post last week in which he argued that trade will be important in slowing climate change. The basic point is that we could do a lot to reduce emissions by encouraging people to buy items where they are produced with the least emissions. The point is well-taken even if Porter’s preferred mechanism, a carbon tax, is a political impossibility for the foreseeable future.
However, what is striking in Porter’s piece, and others making similar arguments, is the refusal to talk about trade in intellectual products, which is arguably a far more important issue in addressing climate change. If that claim sounds strange, it’s probably because of the taboo on even raising the issue in polite discussions.
The basic point is that the United States and other countries are developing a wide range of technologies in areas like wind and solar energy, electric cars, and energy storage, which will be essential for reducing greenhouse gas emissions. If we want these technologies to be as widely adopted as quickly as possible, we should want them to be freely available to everyone at the point they are developed.
In fact, our laws on intellectual property are explicitly designed to prevent technology from being freely available. Patent monopolies prevent anyone from using technologies without the permission of the patent holder.
These monopolies are an extreme form of protection. While modern tariffs rarely exceed 25 or 30 percent, a patent monopoly can make the price of a protected item two or three times its free market price, the equivalent of a tariff of 200 or 300 percent. If we want people to quickly switch to wind or solar power we should want wind turbines and solar panels selling at prices as close to their production cost as possible, not patent monopoly protected prices.
There is the obvious point that we need to provide people with an incentive to innovate in these areas, and the patent monopoly does that. This is true, but there are other ways to provide incentives, most notably we can just pay them upfront for the research.
This is what we did with Moderna when it contracted with Operation Warp Speed to develop a Covid vaccine. The government paid Moderna almost a billion dollars to develop and test the vaccine. Since it was paid upfront, the risk was entirely on the government’s hands. If it turned out that it didn’t work, the government would have been out a billion and Moderna would have still made a decent profit on its work.
Thankfully, the vaccine did work so the government’s money was well spent. Incredibly, we also gave Moderna control over the vaccine, enabling it to make tens of billions of dollars on government-funded research and creating at least five Moderna billionaires.
We can take the first half of the Moderna model and apply it to climate change technologies. We can pay money for the research and then let the resulting innovations sell in a free market. Ideally, we would arrange for other countries to also fund research, making its output freely available as well.
Going this route would also have the advantage that we could require that all funded research be fully open, with results posted on the web as quickly as practical. This would allow researchers everywhere to benefit quickly from the latest findings of other researchers anywhere in the world. They could then build on successes and avoid dead ends.
Unfortunately, the Washington Post and other leading media outlets won’t even allow this sort of discussion of free trade. Needless to say, patent monopolies contribute enormously to inequality in the distribution of income, and those who own and control major media outlets would rather not have questions about patent protection and other forms of intellectual property raised in polite company.
That was the story with the pandemic. The obvious route to have taken at the start of the pandemic, if saving lives was the issue, was to have complete sharing of technology among all countries. We could sort out later who should be compensated and how much.
At the end of the day, some companies or individuals may walk away thinking they didn’t get what they deserved, but so what? We could have spread vaccines, tests, and treatments far more quickly, likely saving millions of lives.
Anyhow, the moral of this story is that as much as trade will be important to dealing with climate change, in polite circles we can only talk about some types of trade. If we start raising questions about the protections that provide the basis for the income of many of the rich, then discussions of trade are not on the agenda.
Read More Leer más Join the discussion Participa en la discusión
The Washington Post ran another “trash the Biden economy, let the facts be damned” piece today. The theme is that the economy is really awful for new college grads. The paper finds us a few real-life examples of struggling recent grads to make its case.
The problem is that the data in the article actually tell the opposite story. While it tells us that the unemployment rate for recent college grads is higher than for the workforce as a whole, it actually is lower than it had been for most of the decade prior to the pandemic.
In fact, instead of being a bad time for recent college grads, the data shown in the graph in the article indicate that their employment prospects are relatively good today. Their unemployment rate was more than 30 percent higher a decade ago.
In fact, this is a point made by the economists featured in the article. The experience of recent grads only looks bad compared to the strong labor market for other workers, it is not a story of recent grads becoming impoverished.
This fact comes out in the other major data point in the piece, the share of young adults (ages 18 to 24) living at home. While it tells us that the share is higher than in 2019, the chart in the piece tells a different story.
For men in this age group, the share living at home is higher than lows hit in 2005-07, just before the Great Recession, but well below the average of the last two decades. There had been an upward trend in the share of women in this age group living at home, with a big pandemic jump. This pandemic jump has now been largely reversed. In other words, the story here is that fewer young women are living at home.
So, the Post really doesn’t have a case for new college grads struggling, but it apparently wants to tell a bad economy story and doesn’t intend to let reality stand in the way.
Read More Leer más Join the discussion Participa en la discusión
Can you imagine doing a 1300-word piece on how ordinary people are faring in the economy and never once mentioning unemployment? Apparently, the New York Times opinion page editors don’t think jobs matter to people, since they ran a column by Karen Petrou (the managing partner of Federal Financial Analytics) that didn’t mention unemployment once. The piece is titled “Why Voters Aren’t Buying Biden’s Boasts About Bidenomics” and uses a cornucopia of bad economics to argue the case against Biden.
It’s hard to know where to begin in addressing this piece, so it’s probably best to start where the piece starts.
“On Oct. 26, the Department of Commerce announced that gross domestic product had grown at an annual rate of 4.9 percent in the third quarter. This growth rate ran well above even optimistic forecasts, leading to what can only be called triumphalism from a White House dead-set on making “Bidenomics” a key to its 2024 presidential campaign. President Biden issued a self-congratulatory statement, the White House echoed it over and over — and Donald Trump’s relative popularity increased.”
Like every president, Biden has talked about economic growth. But he also talks about jobs and wages, sort of like all the time, as when he touted the big wage gains by UAW workers following their strike (which he supported). In fact, the very next week after the GDP report, Biden was very happy to boast about the 21st consecutive month of unemployment below 4.0 percent when the October jobs data were released.
Low unemployment is actually a very big deal for workers, not only because it means they have jobs, but it means that they can leave jobs they don’t like and find better ones. Workers have been doing this in large numbers since the unemployment rate fell to extraordinarily low levels in early 2022. As a result, according to the Conference Board, workplace satisfaction is at its highest level in the nearly forty years they have conducted the survey.
Biden also was happy to boast about wages that were outstripping inflation, a point that sort of squeaks through in the confusion in Petrou’s piece. The piece includes a graph of nominal wage growth and nominal price growth.
The graph shows wage growth modestly outstripping prices through most of Trump’s term, and then hugely outstripping prices in 2020. For Biden we get the opposite story, prices outpaced wages in 2021, then hugely outpaced wages in 2022, but inflation then dropped and wages are again outpacing inflation, with the biggest gains for those at the bottom (contrary to what Petrou told readers).
The pattern here is not much of a mystery to people who follow the economy. Wages hugely outstripped prices in 2020 because tens of millions of low-paid workers in restaurants, hotels and other service industries lost their jobs. When you get rid of low-paid workers, the average wage rises, just as the average height in a room increases if we get the short people to leave.
We saw the opposite story in 2021 as low-paid workers got their jobs back. We also did have the problem of serious supply disruptions created by the pandemic and Russia’s invasion of Ukraine. As the supply problems have eased inflation has come back down.
Inflation due to the pandemic was a worldwide phenomenon, not just something that hit the United States. In fact, we have dealt with the problem very well. The U.S. inflation rate is now the second lowest among major economies, only slightly higher than Japan’s.
It is fair to say that people don’t care that things are worse in Germany or Canada, they care about their own finances. But, Petrou is quite explicitly making an attack on Bidenomics as policy, not the fact that the economy has faced huge headwinds that would have caused serious problems regardless of what policies were pursued.
Ignoring the importance of the pandemic and the Russian invasion would be like complaining about the shortage of housing in an area just devastated by a hurricane and not noting the hurricane. It is understandable that the average person might recognize the damage done by a hurricane more readily than the economic damage caused by the pandemic, but it would be reasonable to expect that a person writing for the New York Times would be familiar with the impact of the pandemic.
Petrou highlights polls showing that most people think that the economy is doing badly and they are not buying Biden’s boasts. That is true, but a recent poll gives us important insights on this point.
The poll shows that roughly half the people think that the economy in their town or city is doing okay, but just 26 percent think the national economy is doing well. This huge gap between people’s assessment of their local economy and their assessment of the national economy cannot be explained by their personal experience. Rather this gap must be attributable to things that they are hearing about the economy from places like Fox News and the New York Times.
Read More Leer más Join the discussion Participa en la discusión


