

July 08, 2022

Maybe we can in Washington, but not in the real world. The bad inflation story of the 1970s was that higher inflation caused workers to demand larger pay increases, which then lead to still more rapid inflation, which meant even larger wage increases, repeat.
That’s a simple story, inflation and wage growth feed off each other, leading to ever higher inflation. Even if the initial rate of inflation was not a problem, after a few rounds of this wage-price cycle, we are looking a pretty bad inflation story.
Many folks want to tell this story about the economy today. However, there is a big problem, the data won’t cooperate. Wage growth is not accelerating, it’s slowing.
Some folks seem to miss this fact because they look at year over year data, comparing the average hourly wage in June of 2022 with the average hourly wage in June of 2021. This comparison gives us a 5.1 percent annual increase, a pace that almost certainly implies a rate of inflation above 3.0 percent.
However, the year-over-year increase is telling us largely what wages did in the past, not what they are doing now. If we want to look more narrowly at what wages are doing at the moment, we can look at the most recent monthly data.
That shows a 0.3 percent rise in the average hourly wage from May to June, which translates into a 3.8 percent annual rate. That is only modestly above the 3.4 percent rate we saw in 2019, when the inflation rate was comfortably below the Fed’s 2.0 percent target.
However, the monthly data are erratic and subject to large revisions, so we can be misled by taking a single month’s data. My preferred measure is to look over a three-month period, using averages for three months.
This means comparing the rate of growth using the average hourly wage for the most recent three months (April, May, and June) compared with the prior three months (January, February, and March). This means looking back somewhat, but it also limits the impact of random error in the wage data.
If we use this calculation, we get an annualized inflation rate for the most recent period of 4.3 percent. More importantly, we see a clear downward trend from a peak of more than 6.0 percent hit at the start of the year. Here’s a picture. (The label shows the middle month of the ending comparison period.)
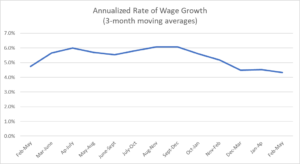
Source: Bureau of Labor Statistics and author’s calculations.
As can be seen, wage growth has been on a downward path since the start of the year. It is very hard to see how we can have a wage-price spiral if the rate of wage growth is actually slowing. If that is the Fed’s concern in its plans for aggressive rate hikes, it looks like it can relax. Wage growth is already slowing rapidly, and may soon be at a pace that is consistent with the Fed’s inflation target, if it is not there already.


Comments