

May 30, 2017

While rising capital share and greater concentration of wealth explain some of the story of economic inequality, the largest part of the story is the growth in wage inequality over the last several decades. Available data from the Social Security Administration unfortunately doesn’t go past 1990, overlooking considerable upward distribution of wages beginning in 1980. However, wage distributions from 1990 to 2015 show a clear, and unequal, upward trend.
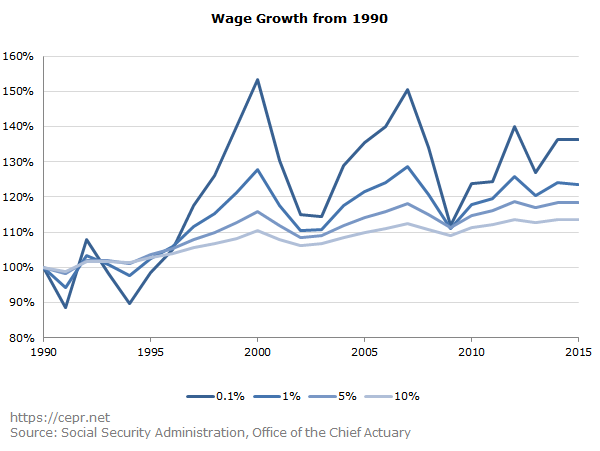
The share of wages earned by the top 0.1 percent of wage earners increased 36 percent in that time period, from 3.5 percent of all wages earned to 4.8 percent. These earners are largely Wall Street bankers and top executives from private companies, as well as hospitals, universities, and other non-profits. Although the data from such a small pool of workers is erratic, they show soaring gains over ordinary workers that coincide with stock market peaks. Wages at this income level are likely paid in part in stock options, so that connection is unsurprising, but the magnitude of wage increases for this group compared to the others supports the argument that wages are part of the inequality picture.
The top 1 percent of wage earners (excluding the 0.1 percent) are largely doctors, dentists, and other highly paid professionals with an average pay of around $333,000 a year. These workers have experienced impressive gains in their share of wages, although they do not compare to those of the 0.1 percent. From 1990 to 2015 the share of wages earned by this group increased 24 percent from 10.7 percent to 13.2 percent.
Lawyers, general practitioners, university professors, and other professionals with advanced degrees make up the top 5 percent of earners (excluding the aforementioned groups). Since 1990 their share of wages earned has grown 18 percent, from 24.0 percent to 28.5 percent. Most of the difference between the share of wages earned by this group and the next lowest, the 90th to the 95th percentile, was gained between 1994 and 2000. Prior to that period both percentile groups’ share of wages grew at a similar rate, and since 2000 the two groups have had similar growth.
The final group of workers included in this analysis adds those who mostly have college degrees but not necessarily advanced degrees. The share of wages earned by the top 10 percent taken as a whole grew 14 percent from 35.5 percent in 1990 to 40.3 percent in 2015.
This analysis only looks at income that is classified as wage income by the Social Security Administration. It does not include compensation in the form of carried interest or business profit from the private practice of a lawyer or doctor. Because of those exclusions, these comparisons likely understate the extent of the upward redistribution of wage income that took place over the 1990 to 2015 period.

