

November 09, 2017
November 2017, Brian Dew
Researchers, partially in response to the slow labor market recovery from the Great Recession and the 2016 presidential election in the United States, are interested in why men, and particularly men without a college education, aren’t as likely to be working. Some explanations point to survey data on how leisure time is used to argue that men aren’t working because they would rather do something else (such as play video games, or engage in other online leisure activities [1]). Other research points to how increasing opioid usage is causing men to be unable to work.[2] One problem with these explanations is that within specific age and education groups, changes to women’s employment outcomes are often actually worse than men’s. That is, the “problem with men” is not specific to men.
This short paper compares changes since 1990 to men’s and women’s employment rates (also called the employment-population ratio)[3] for three age subgroups of men and women without a college education. Changes to the employed share of each group show up in the group’s employment rate, therefore discussion focuses on explanations for similarities and differences in trends in men’s and women’s employment rates since 2000. According to the latest available microdata — the October 2017 Current Population Survey (CPS) — roughly 44 million Americans between the ages of 25 and 54 (sometimes referred to as “prime-age”) report a high school diploma or less as their highest level of educational attainment (35.7 percent of the age 25 to 54 population). Of this group, slightly more than half, or 54.2 percent, are men. The prime-age group is divided into ten-year age subgroups (25–34, 35–44, and 45–54) to reduce the effect of demographic trends on employment rate data.
In the period since 1990, the employment rate for men aged 25 to 34 with a high school or less than high school education peaked in 2000 at 87.4 percent. In the fallout from the recession of 2001, the employment rate for this group fell by 4.6 percentage points and, by the start of the next downturn in 2007, had only recovered by 1.5 percentage points. The Great Recession then resulted in a steep drop in employment rates, which reached a low of 73.6 percent in 2010. Since 2010, the employment rate for the group has recovered by 5.6 percentage points, but the rate currently remains 8.2 percentage points below the 2000 level.[4] (See Figure 1.)
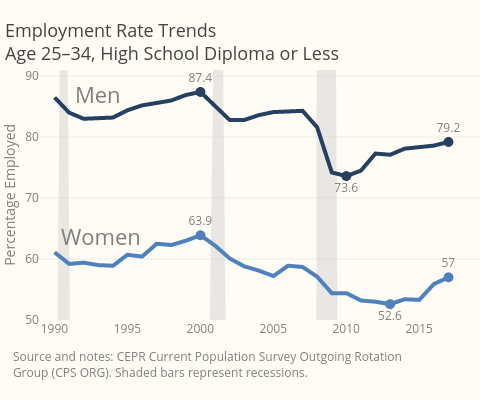
Women with a high school or less than high school education in the same age group (25–34) have not fared much better over this period. The employment rate for this group of women also peaked in 2000, at 63.9 percent; however, it was more deeply affected by the 2001 recession and, unlike the rate for their male counterparts who are three times as likely as the general population to work in the construction industry, recovered very little during the housing bubble that preceded the Great Recession. By 2013, the group’s employment rate had fallen to 52.6 percent, a lower level than at any other point for which comparable data are available (1979–present). Since 2013, the group employment rate has recovered by only 4.4 percentage points and remains 6.9 percentage points below its 2000 peak.
Among men aged 35 to 44 with a high school education or less, the employment rate remained below its 1990 level during both the strong labor market of the late 1990s and the construction bubble from 2004 to 2007. Like the younger cohort, the employment rate for this group fell sharply during the Great Recession, reaching a series low of 77.3 percent in 2010. The total fall in the employment rate from 2000 to 2010 was 8.2 percentage points. Since the 2010 low, the employment rate has improved considerably, increasing by 4.8 percentage points. (See Figure 2.)
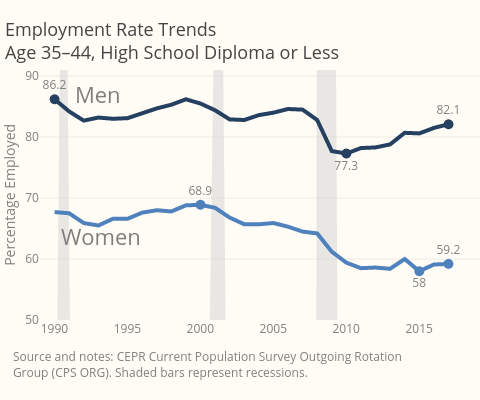
Among women aged 35 to 44 with a high school or less than a high school education, the employment rate peaked in 2000 at 68.9 percent. Much like their younger cohort, there was almost no recovery in the employment rate for this group during the relatively stronger labor market from 2004 to 2007. The employment rate for this group fell during eight years of the decade from 2000 to 2010. Since the Great Recession, there has also been a relative lack of recovery compared to the group’s male counterparts. The employment rate for the group continued to fall until reaching a low of 58.0 percent in 2015 and has recovered from this low by only 1.2 percentage points. The total decline for this group from 2000 to 2015 was 10.9 percentage points, more than double the percentage point drop for men.
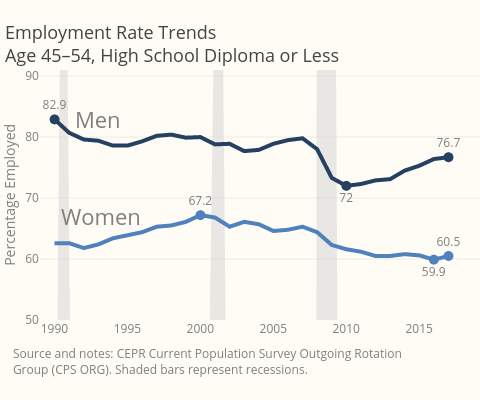
Men aged 45 to 54 with a high school education or less experienced a decrease in employment rates following the 1990 recession, a relatively stable rate from 1992 to 2007, and a sharp decrease during the Great Recession. In 2000, the employment rate for this group was 80.0 percent. By 2010, the employment rate had fallen 8 points to a series low of 72.0 percent. Since 2010, the group employment rate has recovered by 4.7 percentage points.
For women between the age of 45 and 54 with a high school education or less, the employment rate trend shows a relatively steady decline from a peak of 67.2 percent in 2000 to a series low of 59.9 percent in 2016 (the lowest level since 1987). The employment rate for this group improved during only five of the 17 years since the 2000 peak. The preliminary estimate for 2017 (based on monthly data available for January through October) shows a recovery of only 0.6 percentage points since the 2016 low. (See Figure 3.)
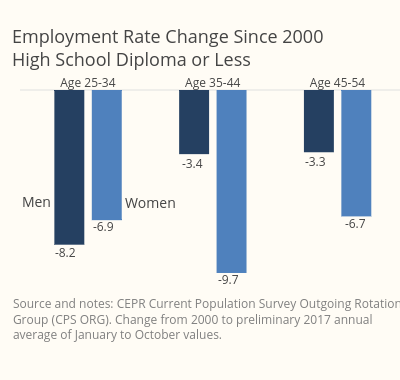
The overall takeaway from the data is that labor market outcomes for women without a college education are little better — and often worse — than for their male counterparts. For the two groups age 35 to 44 and 45 to 54, women experienced much larger overall decreases in employment rates since 2000. For all three groups described above, women’s employment rates have recovered less from the Great Recession than have men’s. (See Figure 4.)
What makes these developments even more striking is the expectation, based on data from other countries, that U.S. women’s participation in the formal labor market continued to increase.[5] This was also the general expectation in 2000, as the peaks reached in that year were part of a long upward trend. The gap between men and women’s employment rates had been closing in the U.S. for decades and continues to close in many other advanced economies. Since 2000, the overall (age above 16, any level of education) women’s employment rates have fallen slightly. For some subgroups of women, such as those without a college education, the trend reversal is enormous.
Moreover, employment rates for men with a high school degree or less than high school education have been improving consistently since 2010. While employment rates for women remain near their lowest level since the 1980s and have only started to increase again in the last few years. The recent reversal in employment rate trends reflects, in part, an improving labor market that has started, in the last few years, to generate broad wage growth.[6]
While men and women in the groups discussed in this section have differing short-term patterns in employment rates, both groups have experienced a long-term decline in employment rates since the year 2000. Economists offer many explanations for these developments. Some such explanations match the data better than others, as explored in the next section.
Explanations for these trends in employment rates since 2000 can be grouped into at least three categories: 1) changes to individuals’ behavior, 2) force-majeure-type explanations involving technological progress, or 3) economic-policy-related failures.
The individual behavior explanations come up short when put to the data. Explaining men’s employment rate declines as their preference for doing something else has logical flaws (what income is used to buy those video games, or simply pay the bills?) but also fails to explain why women face similar or larger declines in employment. Likewise, what then explains how strongly men’s employment rates have recovered over the past few years?
Another reasonable explanation for some of the (albeit minor) differences in employment trends comes from which industries tend to employ men and women from these groups. For example, one explanation for why men in these groups had better employment rate trends during the period from 2004 to 2007 is the overrepresentation of men with high school education or less in the construction industry.[7] During the housing bubble, the construction industry increased employment dramatically by pulling in unemployed workers and training new ones. When the bubble burst, the speed at which housing construction projects were halted led to a very rapid change in employment for the men’s group relative to the women’s group. The relatively slower decline in women’s employment rates may have made the overall decrease, even if of the same magnitude as that of men, less noticeable, and perhaps more insidious.
Likewise, women with less than a college education tend to be over-represented in retail sales, and health care. Retail sales employment has been curbed by the closing of brick and mortar locations, falling from 12.1 percent of total nonfarm employment in 1990 to 10.8 percent in 2017. While the health care industry has been growing, workers (especially those already on the lower-end of wage income) have not been sharing in the gains.[8] Overrepresentation in these two industries may partially explain why women’s employment rates have not recovered since 2010 at the same rate as their male counterparts.
If gender-specific changes to individual behaviors cannot explain the employment rate trends in their entirety, maybe the issue is education? Separately, research has argued that the issue with labor markets is not an overall lack of demand for workers, but a mismatch between the skills of the existing workforce and the skills required for the “jobs of tomorrow.” [9] Technological change may bias labor market outcomes to the benefit of those with more education or education that is specifically matched to new technologies.
There are a few issues with this explanation beyond noting that technological progress is itself a product of policy decisions. The first is that employment rates for men without a college education have been climbing since 2010, opposite to what would be expected if technology were the primary driver of employment trends. Employment rates for those with college or graduate degrees have been relatively flat. As a result, the gap between employment rates for less-educated men and more-educated men, which had increased following the Great Recession, has fallen around 3 percentage points since 2010. For all three age groups of men, employment rates have been growing faster for less educated men since 2010.
The second reason for skepticism around this explanation is that it is hard to find broad groups of winners from this labor market bias. Even for men with college and advanced degrees, median wage growth and employment rate growth has, overall, not been particularly strong during the 21st century. The prime age (25–54) employment rate for men with college or graduate degrees is 2.1 percentage points below its 2000 peak. The real median hourly wages for the more educated group are 2 percent below the 2003 peak.
A third explanation argues that trade, labor market, and monetary policies have cost jobs which would have disproportionately gone to those with less education. The expansion of trade agreements and WTO membership since 1990 has shifted manufacturing to lower-wage countries. Both men and women without a college education are disproportionately employed in manufacturing and therefore disproportionately affected by the geographic shift in manufacturing.
Labor market policies have weakened the bargaining power of low-wage workers over the same period and have failed to keep federal minimum wage rates in line with inflation. Unionization rates have continued to fall since 1990, as have the quality of employment benefits, particularly retirement. A consolidation of firms within industries has also led to less competition between firms for workers and has played a role in the relatively stagnant wage growth period from 2001 to 2014.[10]
Lastly, monetary policy decisions, such as those after the recession of 2001, failed to support the Federal Reserve’s full employment mandate. The Fed decided to start raising interest rates when the unemployment rate was 5.5 percent in July 2004, under the assumption that the unemployment rate was falling to levels that would soon lead to rising inflation. It turns out the economy can support a much lower unemployment rate without generating significant inflation. Allowing the labor market to continue to tighten would have allowed employment rates for less-educated groups to slow or reverse their decline.
As the data show, individual- and gender-specific explanations for employment trends struggle to explain the long-term decline in employment rates among both men and women. Indeed, for two of the three age groups discussed, women’s employment outcomes since 2000 have worsened substantially compared to men’s. Likewise, the most recent data suggest flaws in the skills-bias explanation for labor market outcomes. The gap in employment rates for men with high school education or less than high school education and men with college or graduate degrees has been shrinking since 2010. Data discount the narrative that labor markets are simply responding to changing demands that stem from technological progress. However, the skills-bias narrative, which is fairly widely accepted, has put pressure on Americans to respond individually, rather than collectively, to diminished employment opportunities. One such individual response is borrowing large sums of money to invest in self-training.
Partially in response to both expected technological changes and to policies that have weakened workers’ bargaining power, Americans are increasingly seeking college education to keep up with each other. One result of this trend is that the portion of the U.S. population without a college education is shrinking. That is, the groups examined in this paper have been shrinking. A portion of the people who were in the non-college-educated group in 1990 is now part of the college-educated group. One less-often discussed explanation for employment rate trends is the possibility that the same people who have shifted out of the non-college-educated group had a higher employment probability. That is, a shift towards more education may be biasing downward the employment rate for less-educated groups.
The next short paper in this series will look at labor market outcomes for the growing group of college-educated Americans.
Aguiar, Mark, Mark Bils, Kerwin Kofi Charles, Erik Hurst. 2017. “Leisure Luxuries and the Labor Supply of Young Men.” NBER Working Paper No. 23552, June, accessed October 25, 2017 at http://www.nber.org/papers/w23552.
Appelbaum, Eileen and Rosemary Batt. 2017. “Organizational Restructuring in US Healthcare Systems: Implications for Jobs, Wages, and Inequality.” Washington, D.C.: Center for Economic and Policy Research. https://cepr.net/publications/reports/organizational-restructuring-in-us-healthcare-systems.
Baker, Dean and Daniella Zessoules. 2017. “The Wage Dividend from Low Unemployment.” CEPR Blog, September 14, accessed October 25 at https://cepr.net/blogs/cepr-blog/the-wage-dividend-from-low-unemployment.
Black, Sandra E., Diane Whitmore Schanzenbach, and Audrey Breitwieser. 2017. “The Recent Decline in Women’s Labor Force Participation.” The Hamilton Project Framing Paper, October, accessed October 25, 2017 at http://www.hamiltonproject.org/assets/files/decline_womens_labor_force_participation_BlackSchanzenbach.pdf.
Center for Economic and Policy Research. 2017. “Current Population Survey Outgoing Rotation Group (CPS ORG).” Washington, D.C.: Center for Economic and Policy Research. http://ceprdata.org.
Charles, Kerwin Kofi, Erik Hurst, Matthew J. Notowidigdo. 2016. “The Masking of Decline in Manufacturing Employment by the Housing Bubble.” Journal of Economic Perspective, Volume 30, No. 2, Spring 2016 (pp. 179–200).
Cowen, Tyler and Noah Smith. 2016. “Debating Government’s Role in Boosting Growth: Cowen and Smith.” Bloomberg View, September 12. https://www.bloomberg.com/view/articles/2016-09-12/debating-government-s-role-in-boosting-growth.
Federal Reserve Bank of St. Louis. 2017. “Employment Rate: Aged 25-54: Females for the United States.” FRED, accessed October 25 at https://fred.stlouisfed.org/graph/?g=H0o.
Krueger, Alan. 2017. “Where Have All the Workers Gone? An Inquiry into the Decline of the U.S. Labor Force Participation Rate.” Washington, D.C.: Brookings Papers on Economic Activity. BPEA Conference Drafts, September 7–8, 2017. https://www.brookings.edu/wp-content/uploads/2017/09/1_krueger.pdf.
Steinbaum, Marshall. 2017. “The Effects of Consolidation on the Economy.” Next New Deal, October 18, accessed October 25 at http://rooseveltinstitute.org/effects-consolidation-economy/.
[1] See, for example, Aguiar et al (2017) and Cowen and Smith (2016).
[2] Krueger (2017).
[3] Unlike the employment rate, the labor force participation rate includes people who are unemployed and actively looking for work. Over time, the labor force participation rate is influenced by the availability and quality of unemployment benefits. When these benefits are more generous, workers are more likely to take steps to meet criteria for being considered unemployed, which enables them to receive benefits. The employment rate, which considers only the number of employed persons as a share of the total population, is not affected by changes to unemployment insurance, and therefore provides a less-biased measure of changes labor market outcomes.
[4]The 2017 value is preliminary and calculated as the average of available monthly data for January through September.
[5]See Federal Reserve Bank of St. Louis (2017). For more information on women’s employment trends and international comparisons, see Black, Schanzenbach, and Breitwieser (2017).
[6] Baker and Zessoules (2017).
[7] A 2016 paper from Charles, Hurst, and Notowidigdo describes how the housing bubble masked the decline in manufacturing employment (Kerwin et al. 2016).
[8] Appelbaum and Batt (2017).
[9] Some jobs seem to only exist (or cease to exist) in “tomorrow.”
[10] See for example, Steinbaum (2017).

