June 05, 2015
June 5, 2015
Many media outlets cite the official unemployment rate—the Bureau of Labor Statistics’ U-3 unemployment rate—when reporting on the recovery in the jobs market. This rate stood at 5.0 percent in December 2007 (the first month of the recession) and rose to a high of 10.0 percent in October 2009; it has since fallen to 5.5 percent as of May 2015. Relative to its peak, the unemployment rate has made up 90 percent of the ground lost between December 2007 and October 2009. However, there are good reasons to think that the unemployment rate overstates the degree of recovery in the job market. This series of five measures provide insights on employment and unemployment that aren’t captured by the official unemployment rate.
Incorporating new data for May 2015, three measures showed improvement, one measure worsened, and one was unchanged.
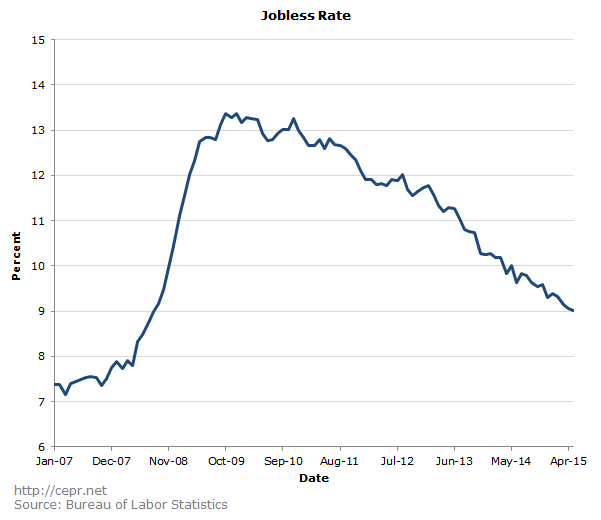
Jobless Rate
The jobless rate takes account of all Americans who say they would like a job, regardless of whether they are classified as “unemployed” or not.
- December 2007 Jobless Rate: 7.76 percent
- Peak: In both October and December of 2009, the jobless rate hit a high of 13.36 percent
- May 2015 Jobless Rate: 9.01 percent
- Percent Recovered: 77.67 percent
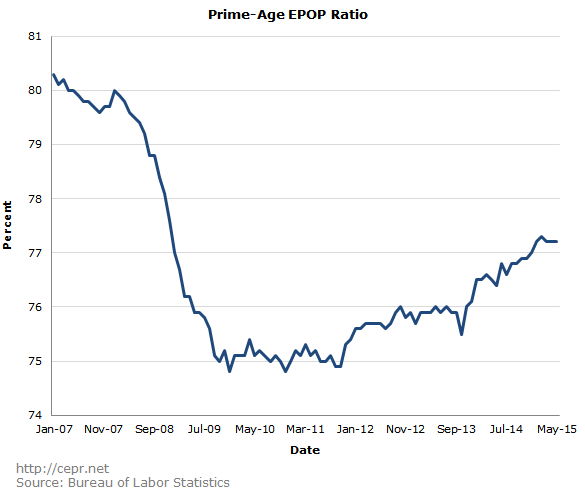
Prime-Age EPOP Ratio
The prime-age EPOP ratio measures the percentage of Americans aged 25 to 54 who are employed.
- December 2007 Prime-Age EPOP Ratio: 79.7 percent
- Trough: In both December of 2009 and November of 2010, the prime-age EPOP ratio hit lows of 74.8 percent. In both instances, the prime-age EPOP ratio recovered slightly before falling again. The last significant trough came in September and October of 2011, when the prime-age EPOP ratio fell to 74.9 percent.
- May 2015 Prime-Age EPOP Ratio: 77.2 percent
- Percent Recovered: 49.0 percent
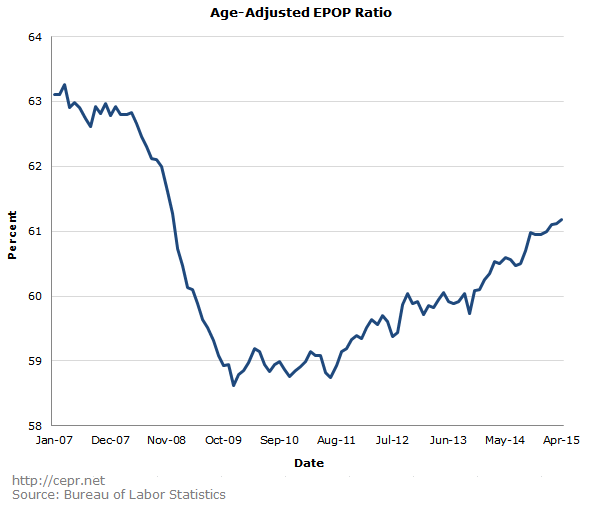
Age-Adjusted EPOP Ratio
The age-adjusted EPOP ratio measures the percentage of Americans that would be employed if the age distribution of the population hadn’t changed since December of 2007.
- December 2007 Age-Adjusted EPOP Ratio: 62.79 percent
- Trough: In December of 2009, the age-adjusted EPOP ratio fell to a low of 58.62 percent.
- May 2015 Age-Adjusted EPOP Ratio: 61.26 percent
- Percent Recovered: 63.31 percent
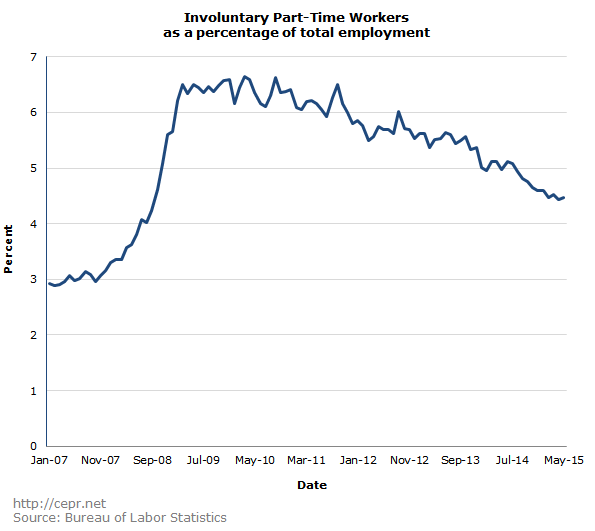
Involuntary Part-Time Employment
Involuntary part-time employment, as a percentage of total employment, shows the percentage of Americans who work part-time for economic reasons but who would like to work full-time.
- December 2007 Involuntary Part-Time Employment Percentage: 3.16 percent
- Peak: In March of 2010, involuntary part-time employment hit a high of 6.65 percent of total employment
- May 2015 Involuntary Part-Time Employment Percentage: 4.47 percent
- Percent Recovered: 62.44 percent
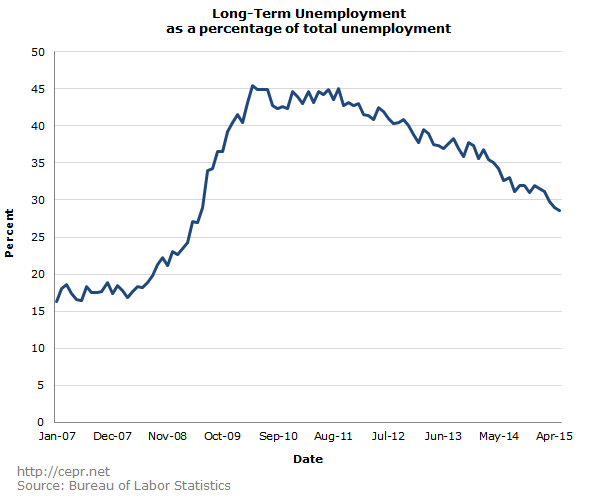
Long-Term Unemployment
Long-term unemployment as a percentage of total unemployment shows us the share of unemployed Americans who have been out-of-work for 27 weeks or more.
- December 2007 Long-Term Unemployment Percentage: 17.4 percent
- Peak: In April 2010, long-term unemployment peaked at of 45.5 percent of all unemployment.
- May 2015 Long-Term Unemployment Percentage: 28.6 percent
- Percent Recovered: 60.14 percent