Dean Baker’s Beat the Press
Beat the Press is Dean Baker’s commentary on economic reporting. He is a Senior Economist at the Center for Economic and Policy Research (CEPR).

Beat the Press is Dean Baker’s commentary on economic reporting. He is a Senior Economist at the Center for Economic and Policy Research (CEPR).
I almost always enjoy Harry Enten’s analyses on CNN. He is usually thoughtful and on target. But he took a big swing and a miss in a piece yesterday on the “fed up” consumer.
Remembering R.I.P. Robert McChesney, a significant voice on media’s role in democracy and progressive thought. He will be missed.

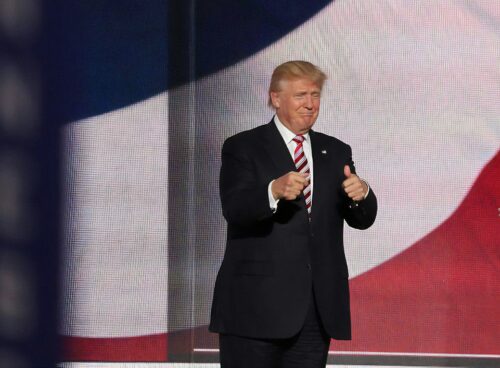
The main question to ask about the Trump administration’s Signalgate fiasco: What would Republicans be saying right now if this had happened while Joe Biden was president?

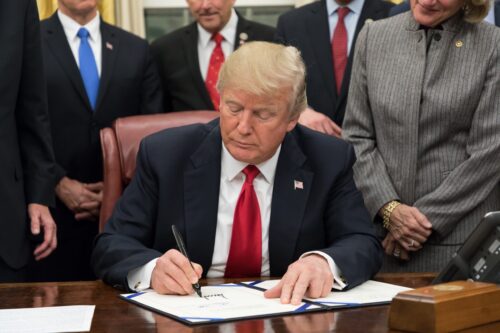
Uncover the ramifications of Trump’s “Tax Day” plan. It could lead to one of the largest tax increases ever seen in the US.
New data on wage gains contradicts the prevailing media narratives about the Biden economy. Would better reporting have changed the outcome of the election?

Explore the connection between consumer technology and unmeasured gains in the Consumer Price Index.

In slightly over two months, Elon Musk and DOGE have committed more major blunders than a million bureaucrats would do in a lifetime.

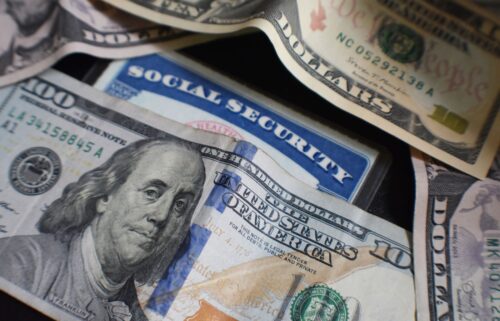
Trump’s Commerce Secretary said that anyone who would complain about not receiving their Social Security benefit check is likely a fraudster. Shouldn’t this be a serious scandal?
Understand the implications of tariffs being implemented on ” Tax Day”, April 2nd, including significant hikes on imports from various countries.
We should think of patent monopolies as taxes that cost households billions while benefiting pharmaceutical companies.