Article • Dean Baker’s Beat the Press
Fact-based, data-driven research and analysis to advance democratic debate on vital issues shaping people’s lives.
Center for Economic and Policy Research
1611 Connecticut Ave. NW
Suite 400
Washington, DC 20009
Tel: 202-293-5380
Fax: 202-588-1356
https://cepr.net
The main thing that careful observers know from watching housing data over the years is that the monthly data should be largely ignored when assessing the housing market. The point here is that random factors have a large impact on monthly sales and price numbers, so that the noise often overwhelms the actual information about the housing market in a single month’s release.
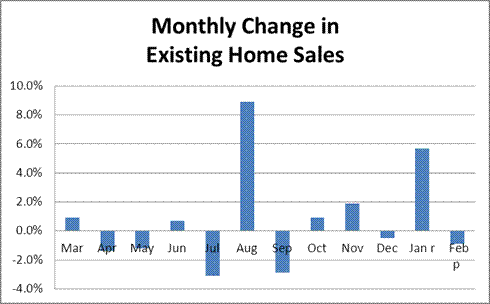
To see the point, let’s start with existing home sales. The Realtors reported a small drop in February from an upwardly revised January number. This touched off a round of news stories about the weak state of the housing market. (The February sales number was higher than the unrevised number, meaning that it was higher than the level of sales that we had thought actually took place in January prior to the release.)

Source: National Association of Realtors.
Note that months where we see big changes in one direction are often followed and/or preceded by a big change in the opposite direction. For example, we could have been alarmed by the 3 percent falloff in sales last July, but then we would have been ecstatic over the 9 percent jump in August, only to be put in the doldrums by the 3 percent drop in September.
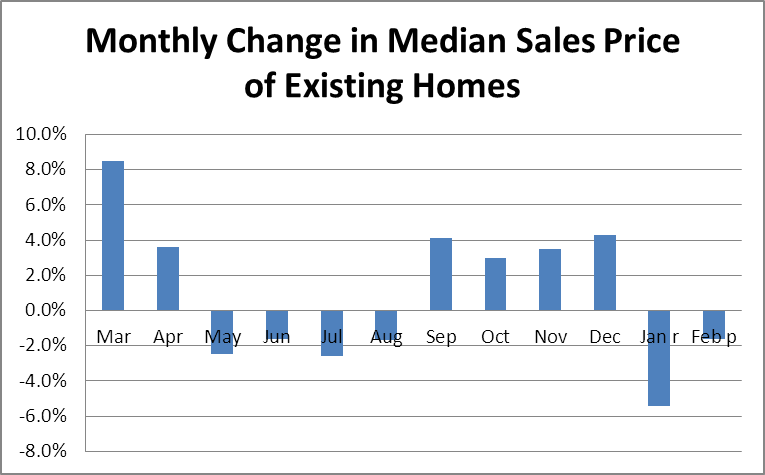
There is a similar story with month to month price changes.

Source: National Association of Realtors.
These data are even more erratic. The 8 percent one-month rise in prices in March must have seemed really exciting. On the other hand, the nearly 5 percent one-month drop back in January must have terrified people. Of course neither of these movements was likely real. These are just random fluctuations in the data.
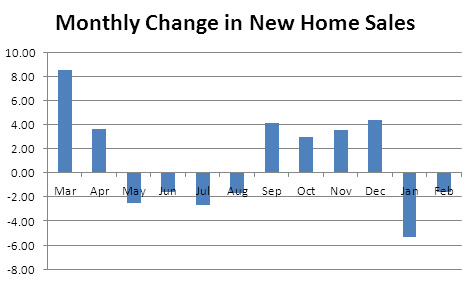
The picture is no better with new home sales. Here are the monthly changes over the last year.

Source: Census Bureau.
Note the great boom showing sales growth of more than 8 percent last March and almost 4 percent in April. This was followed by four consecutive months of declining sales. In short, we see big monthly movements, but no clear patterns.
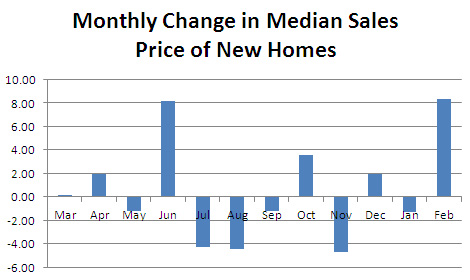
The same applies to the price of new homes.

Source: Census Bureau.
This one shows a huge 8 percent single month jump in prices last June, which was followed by two consecutive months in which prices fell by more than 4.0 percent. This series is even more erratic than the other three.
There are good reasons for expecting these series to be erratic. Factors such as the weather can play a huge role in the number of homes sold. In this case the monthly data might be telling us more about the state of the weather than the underlying market. While sales data (but not the price data) are seasonally adjusted, a milder than normal winter will have a substantial upward impact on the sales data.
The best rule of thumb is to see the monthly data as part of a longer trend. If a number is qualitatively different than the ones that proceeded it, most likely it is the result of random error, not a qualitative change in the market. This is especially true with the price data, in part because these series (unlike the Case-Shiller data) do not control for the mix of housing. This means that a reported price rise may be entirely due to the mix of houses being sold, not a higher price for each house.
Addendum: I have corrected earlier graphing problems.