Article
The Decline of Blue-Collar Jobs, In Graphs

Article
Fact-based, data-driven research and analysis to advance democratic debate on vital issues shaping people’s lives.
Center for Economic and Policy Research
1611 Connecticut Ave. NW
Suite 400
Washington, DC 20009
Tel: 202-293-5380
Fax: 202-588-1356
https://cepr.net
Many have a renewed interest in the shrinking of manufacturing and other traditional blue-collar jobs since Donald Trump won the 2016 presidential election. White working class voters in several large Midwestern states that Democrats had previously carried voted for Trump by large margins. The Blue-Collar Jobs Tracker (BCJT), launched by CEPR, will track the progress of the Trump administration in bringing back these jobs both to the country as a whole and in the states that saw the biggest job loss in the last quarter century. For this analysis, the industries tracked are manufacturing, mining, and construction.[1]
The National Trend in Blue-Collar Employment
In 1970, blue-collar jobs were 31.2 percent of total nonfarm employment. By 2016, their share had fallen to 13.6 percent of total employment. While blue-collar jobs have been declining as a share of total employment over this whole period, this was mostly due to the growth in total employment. The number of blue-collar jobs did not change much through most of this period. In 2000 there were 24.6 million blue-collar jobs, only slightly below the peak of 25.0 million in 1979. However the numbers plunged in the next decade due to the impact of the exploding trade deficit and the 2008-2009 recession. Blue-collar jobs fell to 17.8 million in 2010 and have since rebounded modestly to 19.6 million in the most recent data.
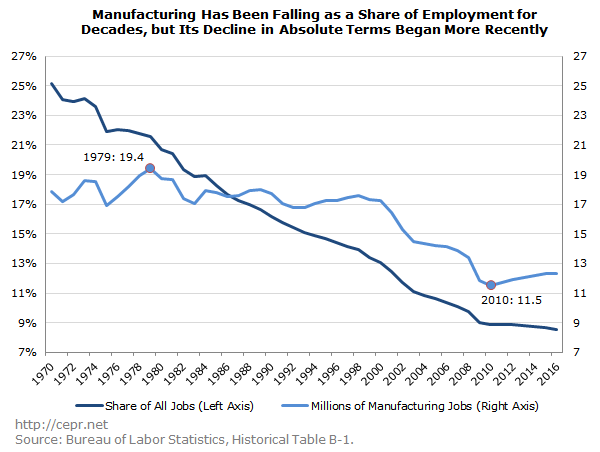
The National Trend in Manufacturing Jobs
Most of the secular change in blue-collar jobs has been in manufacturing. The figure below shows both the absolute number of manufacturing jobs (in millions) and manufacturing’s share of total nonfarm employment from 1970 to 2016. During the 70s, 80s, and 90s, the number of manufacturing jobs basically held steady, with about 17 to 19 million workers being employed in the sector each year. Manufacturing employment then declined every single year from 1998 to 2010. At present there are just 12.3 million manufacturing jobs in the United States.
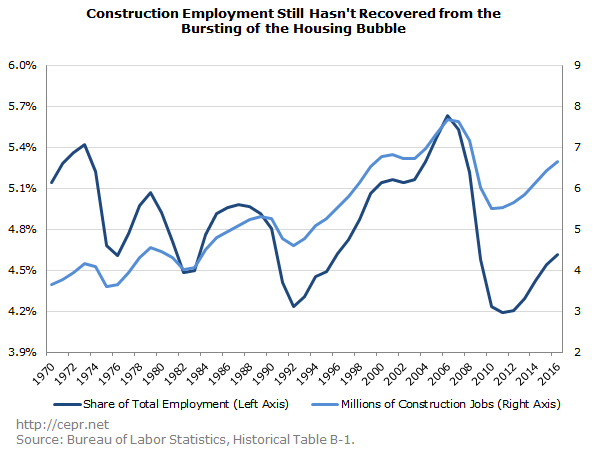
Construction Fluctuates Cyclically, With No Secular Trend
Construction follows a somewhat different pattern. Construction employment is highly cyclical following patterns in the housing market, following the ups and downs in the business cycle, but it has little clear secular trend. In 2016, 4.7 percent of the workforce was employed in construction (6.7 million workers), with the figure heading upward over the course of the year. This is down from the 5.2 percent figure for 1970, but not out of line with the average for that decade.
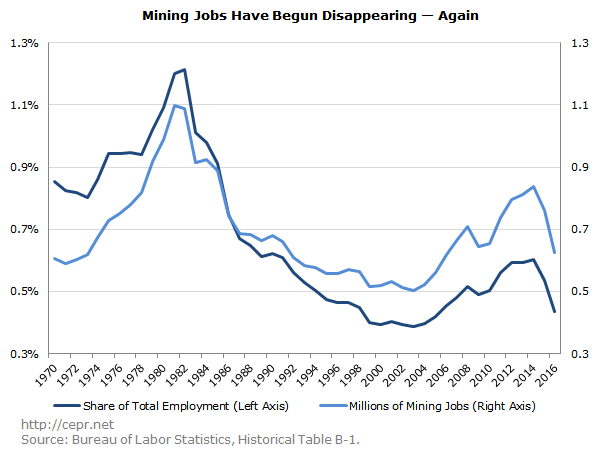
The National Trend in Mining Jobs
Mining employment has largely followed the path of world energy prices as the bulk of employment in the sector is energy-related. Employment in the sector rose through the 1970s and peaked in 1982 at 1.2 percent of total employment. The collapse in world energy prices sent employment in the sector sharply lower in the next two decades, with employment in mining falling to just 0.4 percent of total employment in 1998. Higher energy prices and the fracking boom increased mining employment from 2003 until 2014. Since then, the plunge in energy prices sharply reduced employment, so it again stands at just 0.4 percent of total employment, with 626,000 total jobs in the sector.
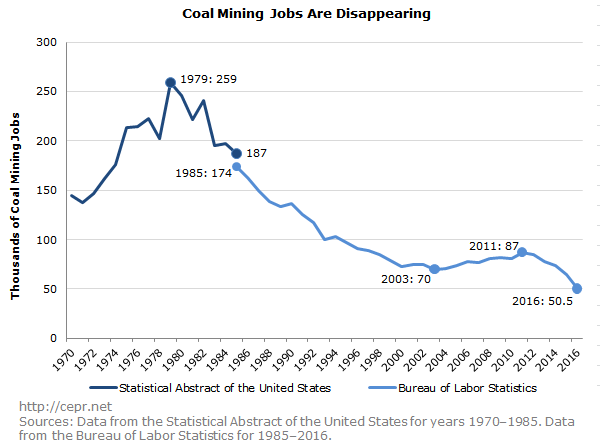
It is also worth noting that the longer-term decline in mining jobs is mostly attributable to a single sub-sector: coal mining. Even though coal mining jobs are a minority of all mining jobs, the job loss in mining has been concentrated in the coal industry. This is shown in the figure below, which uses data from the Bureau of Labor Statistics for 1985-2016 and from various editions of the Statistical Abstract of the United States for 1970-1985.[2]
Manufacturing Jobs in the Midwest
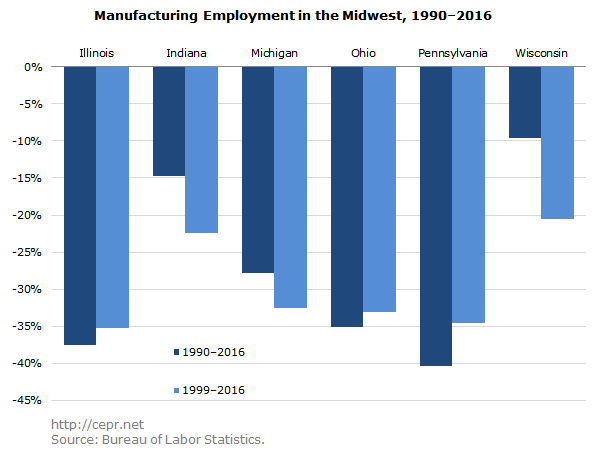
The Midwest has been hit especially hard by the loss of manufacturing jobs. Notably, this is not because manufacturing employment has declined more in the Midwest than throughout the nation at large; in fact, rates of manufacturing job loss have been similar in Midwestern and non-Midwestern states.[3] Rather, it is because manufacturing jobs are a greater share of total employment in the Midwest.
The figure below shows the change in manufacturing employment from 1990 to 2016 and 1999 to 2016 for six Midwestern states: Illinois, Indiana, Michigan, Ohio, Pennsylvania, and Wisconsin. The figure shows most of the drop dates from 1999. Illinois, Michigan, Ohio, and Pennsylvania all lost more than 30 percent of their manufacturing jobs over this period.
Mining Jobs in the Midwest
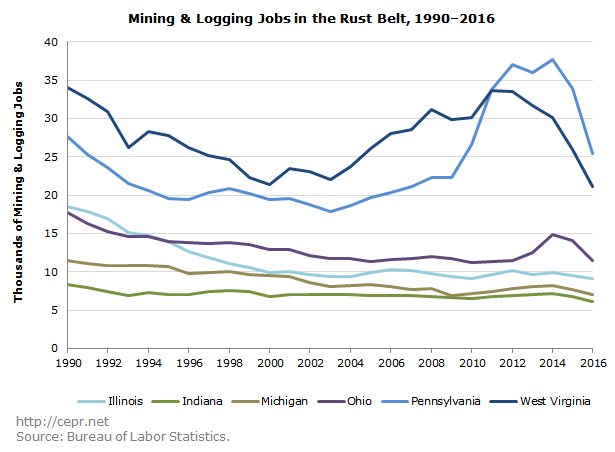
Mining jobs are also disappearing in the Midwest. The figure below shows the total number of mining jobs in six Midwestern states from 1990 to 2016 (state level data only dates back to 1990). Wisconsin has been removed since it has few mining jobs, while West Virginia has been added. West Virginia had somewhat of an employment boom towards the end of the last decade, following the jump in world energy prices, but employment fell back to its lows of the last decade as prices collapsed. There was a similar pattern in Pennsylvania, although even at the 2011 peak, mining jobs accounted for just 0.6 percent of employment in the state. Mining accounts for less than 0.1 percent of employment in the other states.
Blue-Collar Jobs and Statewide Job Growth
In theory, historically blue-collar states could make up for the decline in blue-collar employment by adding jobs in the service sector. However, this has not come to pass – rather than finding new ways to add jobs, blue-collar states have gone into economic decline.
Since the blue-collar employment peak of 2000, states with higher shares of blue-collar jobs have experienced slower employment growth than other states. The scatterplot below compares total job growth in all 50 states from 2000-2016 with the share of jobs that were considered blue-collar in each state as of 2000. As can be seen, there is a strong negative relationship between the share of blue-collar jobs in 2000 and employment growth over this period.
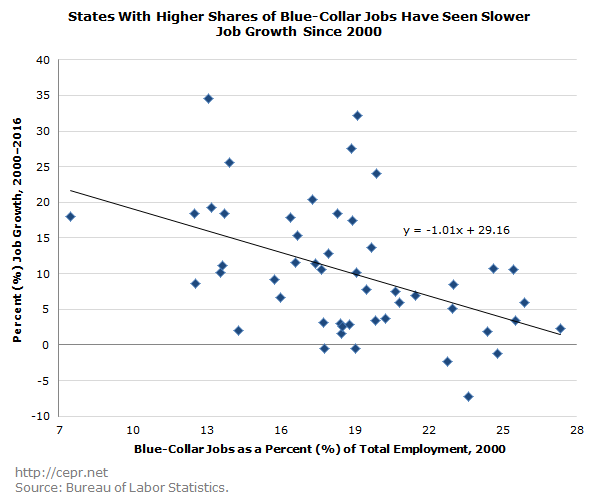
This trend becomes even more obvious when we highlight the stories of specific states. At the national level, 18.7 percent of all jobs in 2000 were blue-collar; and between 2000 and 2016, the nation experienced 9.3 percent job growth. Of the nation’s five most blue-collar states, four experienced significantly slower job growth than the national average:
Similarly, the states with the greatest gains and losses differed strongly in terms of the share of blue-collar jobs in the state. In North Dakota, where just 13.1 percent of jobs were blue-collar as of 2000, job growth was a whopping 34.5 percent. By contrast, in Michigan, where 23.6 percent of all jobs were blue-collar, employment declined 7.3 percent.
In sum, blue-collar employment has fallen sharply since 2000, with a decline in shares of total employment turning into a sharp decline in absolute numbers as well. There has been no easy transition to other sectors for the effected workers, nor for the states with high shares of blue-collar jobs.
[1] The category will be “mining and logging” since at the state level the industries are lumped together. Logging is a relatively small share of employment, accounting for less than 0.1 percent of total employment nationally.
[2] Data are drawn from the following annual Statistical Abstracts:
1972 Edition, pg. 227
1973 Edition, pg. 230
1974 Edition, pg. 347
1976 Edition, pg. 368
1977 Edition, pg. 402
1979 Edition, pg. 410
1981 Edition, pg. 396
1982-1983 Edition, pg. 396
1984 Edition, pg. 427
1985 Edition, pg. 412
1986 Edition, pg. 412
1987 Edition, pg. 396
[3] Between 1990 and 2016, manufacturing employment fell 30.1 percent in the six Midwestern states discussed above. In the nation’s other 44 states, manufacturing employment fell 30.7 percent. The data look only slightly different if we examine the years 1999-2016 (30.7 percent decline in the Midwest and 28.4 percent decline elsewhere).