Article
Education
Article
False Dilemmas in the Social Security Debate
Article
Low-Wage Workers By State
In a recent CEPR brief, we examined the decades-long rise in the educational attainment of low-wage workers at the national level. The table and figures below (or after the jump) show this same educational upgrading is evident across all 51 states (includ
Article
College Aid Not Keeping Pace with College Costs
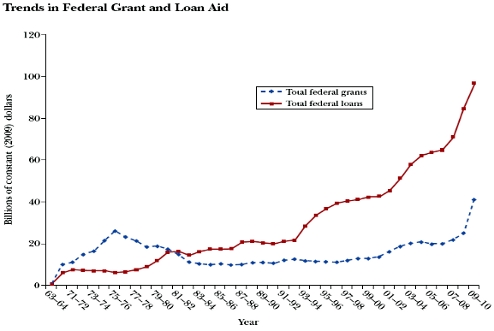
People who haven’t gone through the financial aid process (recently or at all) might think of financial aid as mostly about grants or scholarships. Financial aid, however, comes largely in the form of federal loans, which a student must pay regardless of whether they complete their degree or not. Grants and scholarships are awarded, but they have not kept pace with the rising costs of education. The average Pell Grant, for example, has increased from $929 in 1979 to $3,706 in 2009 — a near 300% increase. This may sound like a lot but not when compared to the 548%, 807% and 620% increases in average annual tuition for (respectively) a 2-year, 4-year public and 4-year private college.
There is evidence to suggest that there has been a significant shift away from the ‘need-based’ philosophy of Pell Grants: the much more rapid growth of non-need-based aid like student loans, as shown in the graph, or the expansion of tax credits, which tend to disproportionately benefit middle- and upper-income families. As a result, according to the Federal Reserve Bank of New York, the average outstanding student loan balance per borrower is $23,300.
Source: Avery, C. and Turner, S. Student Loans: Do College Students Borrow Too Much – Or Not Enough?; Journal of Economic Perspectives, Volume 26, No. 1, Winter 2012, Pg. 165- 192
This means students from low-income families are not getting the help they need with funding their educations. (CEPR recently looked at the increase in the financial burden facing minimum-wage workers paying for college.) In fact, unmet need (i.e. expenses after expected family contribution and grant aid) of enrolled students averages 72% of family income (2007 dollars) for families in the lowest income quintile, versus 14% for those in the top quintile. In a recent report by the Education Trust of 1,186 four year colleges and universities, some 275 institutions required low-income students to pay more than 100% of family income.
Article
College Comparisons
Paul Krugman has reproduced an OECD chart that was featured in a recent post by Jared Bernstein. The graph of interest (below) contrasts the share of older and younger people in OECD countries that have the equivalent of a four-year college degree or mor
Article
Affording Health Care and Education on the Minimum Wage
The current value of the federal minimum wage — $7.25 per hour — is often compared to the cost of living, the average wage in the economy, or the productivity of the average worker. By all of these benchmarks, the current federal minimum is well below its
Article
Affirmative Action for School Reformers?
Dean Baker
Truthout, March 12, 2012
Article
Labor Market Policy Research Reports, Nov. 21 – Dec. 2, 2011
Article
Pew Survey on College
Article
College
Catherine Rampell had a post last week declaring that “College is (Still) Worth It“. The piece is the latest in a series that she and her Economix blog colleague, David Leonhardt, have written on the financial benefits of college.
I agree with Rampell and Leonhardt that college is, on average, a good investment for the people who make it. But, Rampell and Leonhardt’s posts completely sidestep the key issue: why is it that when confronted with compelling evidence that college pays a big financial dividend, so many young people still don’t get a college degree?
Heather Boushey and I argue that the short answer is that for a surprising share of college graduates, the large price tag may actually not pay off.
Rampell’s latest installment includes this nice graph of weekly earnings by worker characteristics, including educational attainment on the right-hand side:

Source: New York Times, Bureau of Labor Statistics