
Article
The Bank Bailout of 2008 Was Unnecessary
Dean Baker
The Los Angeles Times, September 14, 2018
Article
Dean Baker
The Los Angeles Times, September 14, 2018
Article
Dean Baker
Truthout, August 27, 2018
Article
Dean Baker
The Hankyoreh, August 19, 2018
July 12, 2018
Data Bytes
July 12, 2018 (Prices Byte)
Article
Dean Baker
Truthout, June 4, 2018
Article
Eileen AppelbaumThe Hill, February 1, 2018
Article
While inflation-adjusted house prices are still far below bubble peaks nationwide, they have been outpacing inflation for the last five years and are well above their long-term trend levels. However, these prices may be justified by unusually low-interest rates (both real and nominal) in the years following the Great Recession. Also, unlike the bubble period, rents have been outpacing inflation in most markets, suggesting that house prices are responding to the fundamentals of supply and demand in the housing market rather than being driven by a speculative frenzy.
Nonetheless, there are sharp divergences in trends by geographic market area. The Case-Shiller tiered house prices index has been showing the sharpest increases in the bottom third of the market in most of the cities it covers. This raises the possibility that at least this segment of the market may be driven by speculation rather than fundamentals.
In a paper in the fall of 2016, CEPR examined the evidence in some of these cities to see if rents appeared to be following in step with house prices in the bottom tier of the Case-Shiller indices (CSI). As a measure of rents, we used the Department of Housing and Urban Development’s estimate of the fair market rent (FMR) for a two-bedroom apartment. This measure is somewhat different in construction from the Case-Shiller indices. It is not measuring the rent changes for a fixed set of units, but looks at average rents for different units year-by-year. Nonetheless, it should give a reasonable approximation of trends in the segment of the rental market that most directly competes with the bottom third of the home sale market.
Article
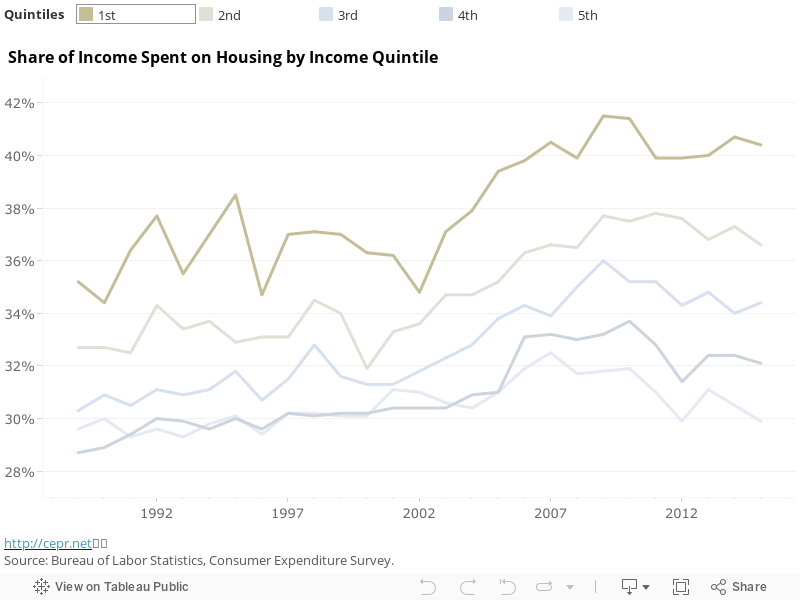
Data from the Consumer Expenditure Survey show that the bottom 60 percent of the US population has been spending over 30 percent of their income on housing since before 1989. In 1981, the Department of Housing and Urban Development (HUD) issued a recommendation that a maximum of 30 percent of household spending go to housing costs. This clearly has not been the norm for most households over the last three decades.
For the lowest income quintile (with an average income of $10,916 in 2015), rising housing costs are an especially large burden, averaging over 40 percent of income spent on housing each year since 2007. At the other end of the income spectrum, the top income group (average income of $177,851 in 2015) spent more than recommended on housing for a majority of the years analyzed, although the most recent numbers are back below 30 percent.
Article
Guidelines from the Department of Housing and Urban Development recommend that households spend no more than 30 percent of their income on housing. The reality, however, is that over half of U. S. households spend more than that. A burden which the department notes can cause households to struggle to afford “necessities such as food, clothing, transportation and medical care”.

CEPR compared Fair Market Rent for a one-bedroom appartment in some of the U.S.’s largest metropolitan areas to monthly income based on each city’s minimum wage to get a more accurate picture of housing costs for the majority of the population.
Unsurprisingly, San Francisco, CA wins as the “most unaffordable” city to live in based on this data analysis. One month of full-time minimum wage work at $13 an hour would net the worker $2,080 and their fair market rent would be $2,411, or 116 percent of their monthly income. This disparity puts San Francisco a full 30 percentage points above second-place contender, Philadelphia. At the opposite end of the spectrum, full-time minimum wage workers in Dallas, TX earn $1,160 at $7.25 per hour and pay 41 percent of it, $679, in fair market rent. This is the lowest percentage of any of the cities analyzed, although it is still well above the 30 percent federal guideline.