Article • Dean Baker’s Beat the Press
Fact-based, data-driven research and analysis to advance democratic debate on vital issues shaping people’s lives.
Center for Economic and Policy Research
1611 Connecticut Ave. NW
Suite 400
Washington, DC 20009
Tel: 202-293-5380
Fax: 202-588-1356
https://cepr.net
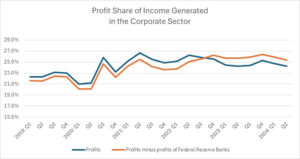
There continues to be a debate about the extent to which “price-gouging” or “greedflation” has been responsible for the rise in prices since the pandemic. We can debate the extent to which companies were able to take advantage of monopoly power during the pandemic, but whatever the cause, it is clear that the profit share of corporate income has risen from before the pandemic, as shown in the graph below.

Source: Bureau of Economic Analysis.
In the four quarters before the pandemic, the profit share averaged 22.7 percent of the net income generated in the corporate sector.[1] It rose to 26.6 percent in the second quarter of 2022, and has since fallen back somewhat to 24.3 percent in the second quarter of 2024.
This measure of profits includes the profits earned by the regional Federal Reserve Banks. Since that money is mostly refunded to the Treasury, it arguably should not be included in a measure of corporate profits.[2] In 2019 the profits share averaged 22.0 percent of net income, excluding the profits of the Federal Reserve Banks. This share peaked at 26.2 percent in the fourth quarter of 2022, it has edged down to 25.3 percent in the most recent quarter. (The regional Federal Reserve Banks are currently losing money as a result of higher interest rates, so the profit share is higher when these loses are excluded.)
By either measure the profit share in the most recent quarter is higher than before the pandemic. Using the first measure, the share has increased by 1.6 percentage points from the four quarters before the pandemic. By the measure that excludes the profits of Federal Reserve Banks, the profit share has risen by 3.3 percentage points.
We can argue whether we want to describe this shift from labor to capital as “big” or “small.” It clearly does not explain the bulk of the inflation we have seen since the pandemic. Inflation as measured by the CPI has been 20.9 percent since the start of the pandemic. That means the rise in profit shares, using the measure that excludes profits from the Federal Reserve Banks, explains a bit more than 15 percent of the inflation we saw.
On the other hand, the impact looks considerably more important if we compare it to real wage growth over this period. Real hourly wages have risen just 1.6 percent since the pandemic. If the profit shares had remained constant over the last four and a half years, wages would be roughly 3.3 percent higher than they are now, which would translate into real wages being roughly 3.3 percent higher. That would triple the amount of real wage growth we have seen over this period. (This is a crude calculation, since some items in the consumption basket, most notably rental housing, are not primarily produced by the corporate sector.)
In short, we can debate the dynamics of inflation and the shift from wages to profits in the pandemic. But the fact that there was a substantial shift is difficult to dispute.
There is one important qualification to this story. There has been an unusually large statistical discrepancy in the GDP accounts in recent quarters, rising to 2.7 percent of GDP in the second quarter of 2024 (NIPA Table 1.7.5., Line 34). The statistical discrepancy is the gap between GDP as measured on the output side and GDP as measured on the income side.
In principle, these two numbers should be equal, in the same way that if we counted people starting from the left side of the room we should end up with the same number as if we counted people starting from the right side of the room. As a practical matter, in a $27 trillion economy, they will never come out exactly the same.
As it stands, the output side measure is considerably higher than the income side measure. It may turn out that with future revisions, the output side measure is revised down, and the income side measure proves to be closer to the mark.
However, it may also turn out to be the case that the income side measure is seriously under-estimated and revised up to a level close to the output measure. In that case, the balance between profits and labor compensation could be affected by future revisions. To take an extreme case, if the full statistical discrepancy was found to be an undercount of labor income, then the reported rise in the profit share would largely disappear.
To be clear, assuming that all the gap was an undercount on the income side, and this was in turn entirely an undercounting of labor compensation, would be very extreme and unlikely. But it is important to note that the picture may look different when we get revisions to the data, both this month and in subsequent years.
In the meantime, we have to work with the data we have. And these data show there was a substantial redistribution from labor to capital in the period since the pandemic hit.
Addendum: After posting this note, I realized I should have deducted the profits of Federal Reserve Banks from the denominator. This would have raised the profit share in 2019 by 0.1 pp to 22.1 percent and lowered in the most recent quarter by 0.2 pp to 25.1 percent. That would make the rise in profit shares 3.0 percentage points instead of 3.3 percentage points.
[1] This calculation takes net operating surplus (profits, interest, and business transfers), NIPA Table 1.14, Line 24 over the sum of net operating surplus and labor compensation, NIPA Table 1.14, Line 20.
[2] The Federal Reserve Bank profits are taken from NIPA Table 6.16D, Line 11.