Report
August 2016, Cherrie Bucknor
Executive Summary

This study uses the most recent Census Bureau data available to examine the trends in unionization for Black workers, focusing on unionization rates as well as the demographic composition of the Black union workforce. This paper also presents data on the impact of unionization on the wages and benefits of Black workers and how these benefits work to reduce racial wage inequality.
Unionization rates have been in decline across the board for decades. Despite this fact, Black workers are still more likely than workers of any other race or ethnicity to be unionized. In 2015, 14.2 percent of Black workers and 12.3 percent of the entire workforce were represented by unions, down from 31.7 percent and 23.3 percent, respectively, in 1983. This large decline in unionization has occurred alongside, and contributed to, an increase in overall wage inequality, as well as the widening Black-white wage gap.
This paper finds that Black union workers of today are very different from Black union workers of the past. In particular, Black union workers today are more likely to be female, older, have more years of formal education, be immigrants, and work in the public sector.
Black union workers also enjoy higher wages, and better access to health insurance and retirement benefits than their non-union peers. These benefits persist even after controlling for systematic differences between the union and non-union workforce. Specifically, Black union workers on average earn 16.4 percent higher wages than non-union Black workers. Black union workers are also 17.4 percentage points more likely than non-union Blacks to have employer-provided health insurance, and 18.3 percentage points more likely to have an employer-sponsored retirement plan.
These benefits are also large for Black workers in low-wage occupations and those with fewer years of formal education. Black union workers in low-wage occupations have wages that are 18.9 percent higher than their non-union counterparts, are 13.1 percentage points more likely to have employer-provided health insurance, and 15.4 percentage points more likely to have employer-sponsored retirement plans. Furthermore, Black union workers with less than a high school degree have a wage advantage of 19.6 percent over their non-union peers, and are 23.4 percentage points and 25.2 percentage points more likely to have health insurance and a retirement plan, respectively.
Some other highlights include:
- The percent of Black union workers who are immigrants has more than doubled since 1994: from 7.0 percent in 1994, to 15.4 percent in 2015.
- Black immigrants are more likely than native Blacks to be unionized. In 2015, Black immigrant workers had a unionization rate of 16.9 percent compared to 13.8 percent for native Blacks.
- Unionization rates for Black workers have declined across all sectors, but the decline has been especially steep for manufacturing (from 42.3 percent in 1983 to 13.3 percent in 2015).
- Black union workers on average earn $24.24 per hour, compared to $17.78 for non-union Black workers.
- 71.4 percent of Black union workers have employer-provided health insurance, compared to 47.7 percent of non-union Black workers.
- 61.6 percent of Black union members have employer-sponsored retirement plans, compared to 38.2 percent of non-union Black workers.
Introduction
Black workers are more likely than workers of any other race to be unionized.1 This has been true since at least the early 1970s. Blacks are also over-represented in the union workforce, with 14.1 percent of union workers being Black, but only 11.9 percent of the overall workforce being Black. However, the Black unionization rate has been declining throughout this period, as has the overall unionization rate. Given the importance of unions in combating racial wage inequality, the decline of Black worker power through unions presents an obstacle to efforts to reduce inequality.
This report uses Census Bureau data to examine the trends in unionization for Black workers, focusing on unionization rates as well as the demographic composition of the Black union workforce. This paper also presents data on the impact of unionization on the wages and benefits of Black workers and how these benefits work to reduce racial wage inequality.
The data show Black union workers of today look much different from their predecessors of the early 1980s. Black union workers today are more likely to be older, female, foreign-born, have more years of formal education, and work in the public sector.
The data further suggest that unions significantly boost the wages and access to health and retirement benefits of Black workers. Even after taking into account systematic differences among the union and non-union populations, Black union workers have wages that are 16.4 percent higher than their non-union counterparts. The union wage advantage is even more for Black men (19.3 percent), and Black workers in low-wage occupations (18.9 percent). Black union workers are also 17.4 percentage points more likely than non-union Blacks to have employer-provided health insurance, and 18.3 percentage points more likely to have an employer-sponsored retirement plan.
Black Workers and Unions
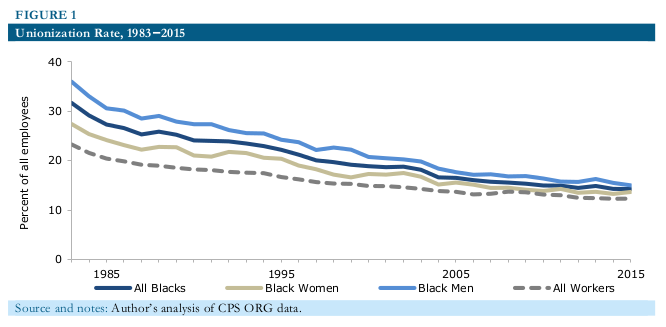
In 1983, 31.7 percent of Black workers were represented by a union.2 As Figure 1 shows, the Black unionization rate has fallen drastically since then, with only 14.2 percent of Black workers represented by a union in 2015. Black men had a unionization rate of 36.0 percent in 1983, which dropped to 15.0 percent in 2015. Similarly, Black women’s unionization rate went from 27.4 percent in 1983 to 13.6 percent in 2015. However, Black workers are not the only ones to experience this — workers overall have seen their unionization rate drop from 23.3 percent in 1983 to 12.3 percent in 2015.
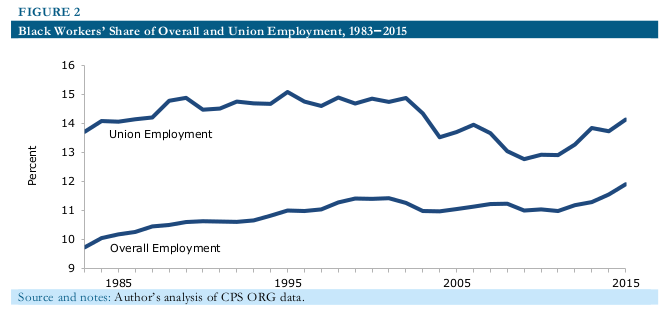
Black workers are overrepresented in the union workforce. In 1983, Blacks were 13.7 percent of the union workforce, and in 2015, they were 14.1 percent of the union workforce (Figure 2). However, Black workers were only 9.7 percent of the overall workforce in 1983 and 11.9 percent of the overall workforce in 2015.
There have been some notable changes in the demographic composition of the Black union workforce since 1983. As Table 1 shows, there are also important differences between Black union workers and the overall Black workforce. For instance, in 1983, Black women made up half of the overall Black workforce, but only 43.5 percent of the Black union workforce. By 2015, Black women made up over half of the overall and union workforce (54.0 percent and 52.2 percent, respectively).
TABLE 1
Composition of Black Workforce and Black Union Workers, 1983 and 2015 (percent)
| 1983 | 2015 | Change (p.p.) | ||||||
| Employees | Union | Employees | Union | Employees | Union | |||
| Men | 50 | 56.5 | 46 | 47.8 | -4 | -8.7 | ||
| Women | 50 | 43.5 | 54 | 52.2 | 4 | 8.7 | ||
| Age | ||||||||
| 16-24 | 18.6 | 8.2 | 14.8 | 5.8 | -3.8 | -2.4 | ||
| 25-34 | 32.2 | 31.3 | 24 | 19.2 | -8.2 | -12.1 | ||
| 35-44 | 22.3 | 27.9 | 22.5 | 24.5 | 0.2 | -3.4 | ||
| 45-54 | 15.3 | 20.1 | 21.2 | 26.8 | 5.9 | 6.7 | ||
| 55-64 | 9.7 | 11.8 | 13.8 | 19.4 | 4.1 | 7.7 | ||
| 65+ | 1.9 | 0.8 | 3.7 | 4.3 | 1.8 | 3.6 | ||
| Education | ||||||||
| Less Than HS | 27.6 | 24.2 | 5.5 | 2.5 | -22.2 | -21.7 | ||
| High School | 37.6 | 39 | 33 | 28.8 | -4.6 | -10.2 | ||
| Some College | 22.4 | 21.6 | 34.3 | 34.9 | 11.9 | 13.3 | ||
| College + | 12.4 | 15.1 | 27.3 | 33.7 | 14.9 | 18.6 | ||
| Immigrant | — | — | 13.1 | 15.4 | — | — | ||
| Manufacturing | 21.3 | 28.6 | 8.8 | 8.3 | -12.5 | -20.3 | ||
| Public Sector | 25 | 37.6 | 18.7 | 48.2 | -6.3 | 10.6 | ||
| Region | ||||||||
| Northeast | 17.4 | 25.5 | 16.6 | 32.4 | -0.9 | 6.9 | ||
| Midwest | 17.1 | 25 | 17.1 | 19.3 | -0 | -5.7 | ||
| South | 56 | 37.5 | 57.2 | 35.5 | 1.2 | -2 | ||
| West | 1.1 | 1 | 2.5 | 1.7 | 1.3 | 0.7 | ||
| Pacific | 8.3 | 11 | 6.7 | 11.1 | -1.6 | 0.1 |
Notes: Author’s analysis of CPS ORG data, 1983 and 2015.
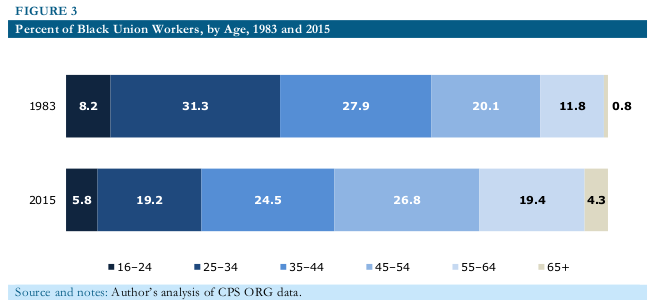
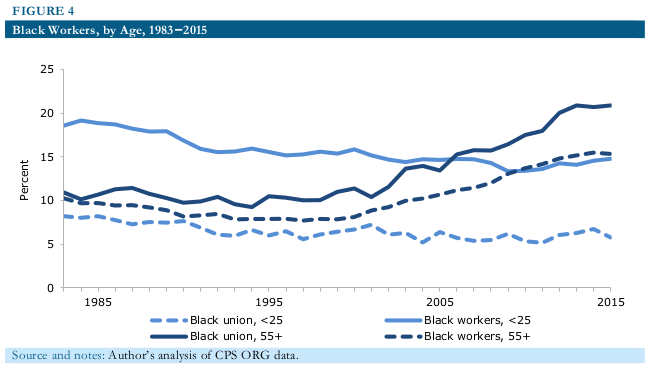
Black workers as a whole have also become older, especially those who are represented by unions. In 1983, 18.6 percent of all Black workers were under the age of 25, and 32.2 percent were between the ages of 25 and 34. By 2015, these numbers had dropped to 14.8 percent and 24.0 percent, respectively. In 1983, only 8.2 percent of Black union workers were under age 25 and in 2015, 5.8 percent were (Figure 3). Also in 2015, 23.7 percent of Black union workers were ages 55 and older, compared to 12.6 percent in 1983. As Figure 4 shows, there has been a steady decline in the share of Black union workers under the age of 25, and a corresponding increase in the share that are 55 and older.
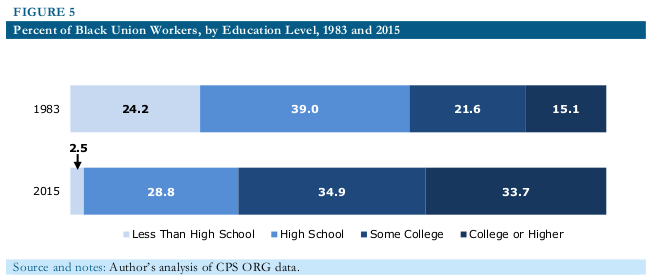
The overall workforce has become much better educated over the past three decades and the same is true for Black workers. In 1983, almost a quarter (24.2 percent) of Black union workers had less than a high school degree, and another 39.0 percent had only a high school degree (Figure 5). During the same year, 36.7 percent of Black union workers had at least some college experience. By contrast, in 2015, only 2.5 percent of Black union workers had less than a high school degree and 28.8 percent had a high school degree. Also in 2015, 34.9 percent of Black union workers had only some college experience, and 33.7 percent had a bachelor’s degree or higher.
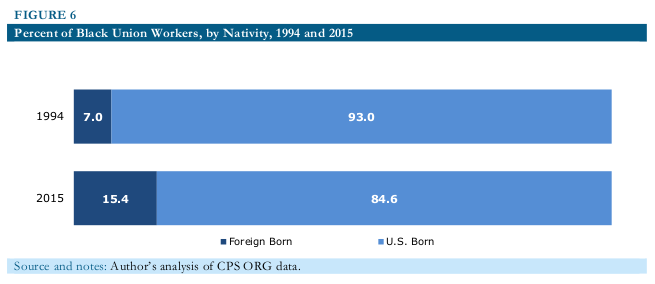
The share of union workers who are foreign-born has more than doubled over the past 20 years (Figure 6). In 1994, 7.0 percent of Black union workers were foreign-born and in 2015, 15.4 percent were.
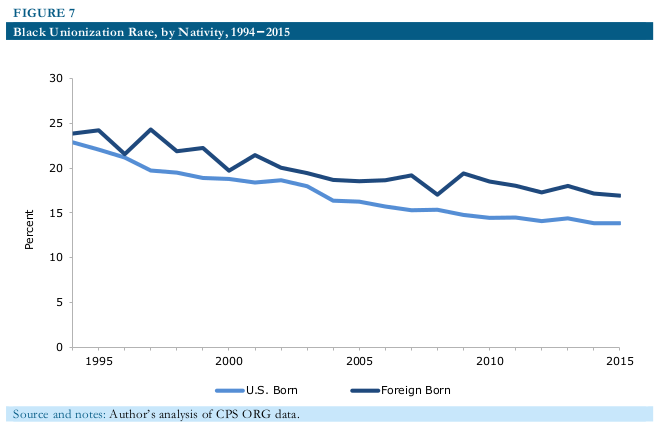
In addition to their increasing share of the Black union workforce, immigrant workers have also maintained a higher unionization rate than their U.S.-born peers (Figure 7). In 1994, 23.9 percent of immigrant Black workers were represented by a union, compared to 22.9 percent of U.S.-born Black workers. Although both immigrants and non-immigrants have seen their unionization rates decline over the past 20 years, rates have fallen faster for native-born Black workers, increasing the gap between them and immigrant Black workers. In 2015, 16.9 percent of immigrant Black workers were represented by unions, while 13.8 percent of native-born Blacks were represented by unions.
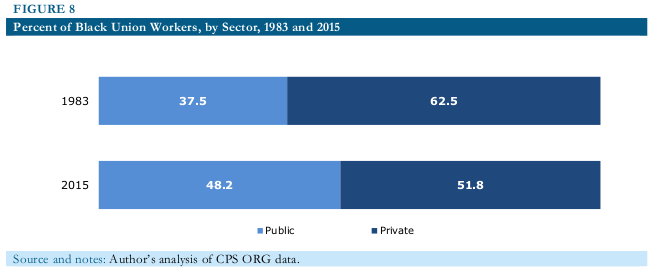
In 1983, 37.6 percent of Black union workers were employed in the public sector and 62.5 percent were employed in the private sector. In 2015, unionized Black workers were almost evenly split between the public (48.2 percent) and private (51.8 percent) sectors (Figure 8). This increase in public sector employment among unionized Black workers is in direct contrast to what has occurred amongst Black workers overall. In 1983, 25.0 percent of all Black workers had jobs in the public sector, compared to only 18.7 percent in 2015 (Table 1).
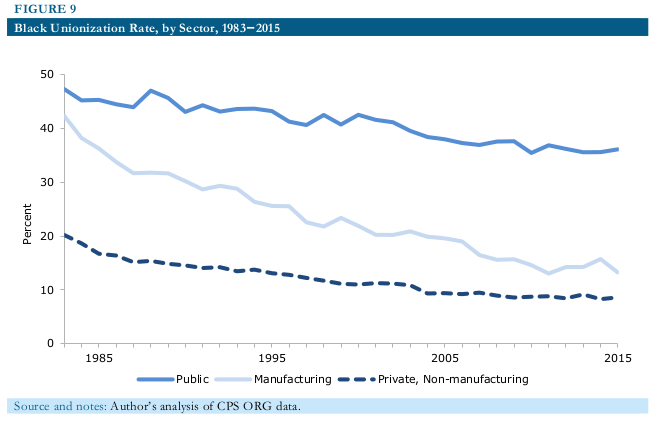
As Figure 9 shows, unionization rates have been falling for Black workers across sectors. The decline has been especially steep for those in the manufacturing sector, which has historically been a stronghold for union organizing. In 1983, 42.3 percent of Black workers in manufacturing were unionized, compared to only 13.3 percent in 2015. Over the same period, unionization rates in the public sector went from 47.3 percent to 36.1 percent, and the rate for private-non-manufacturing jobs changed from 20.2 percent in 1983 to 8.6 percent in 2015.
Tables 2 and 3 display the top unionized industries and occupations for Black workers between 2010 and 2015. Industries and occupations that generally fall in the public sector have high rates of unionization compared to those that are primarily within the private sector. In particular, education-related industries and occupations as well as jobs in public administration and the protective services all have unionization rates above 30 percent.
TABLE 2
Top 20 Unionized Industries for Black Workers, 2010-2015
| 1 | Public Administration | 33.3 |
| 2 | Educational Services | 31.3 |
| 3 | Transportation and Warehousing | 31.2 |
| 4 | Utilities | 29.5 |
| 5 | Transportation Equipment Manufacturing | 27.6 |
| 6 | Waste Management and Remediation Services | 23.3 |
| 7 | Other Information Services | 23.0 |
| 8 | Telecommunications | 19.3 |
| 9 | Hospitals | 19.0 |
| 10 | Primary Metals and Fabricated Metal Products | 17.8 |
| 11 | Construction | 17.4 |
| 12 | Petroleum and Coal Products | 17.3 |
| 13 | Plastics and Rubber Products | 16.6 |
| 14 | Paper and Printing | 15.8 |
| 15 | Beverage and Tobacco Products | 14.9 |
| 16 | Food Manufacturing | 14.7 |
| 17 | Electrical Equipment, Appliance Manufacturing | 13.4 |
| 18 | Motion Picture and Sound Recording Industries | 12.3 |
| 19 | Nonmetallic Mineral Products | 12.3 |
| 20 | Arts, Entertainment, and Recreation | 12.0 |
Source: Authors’ analysis of CPS ORG data.
TABLE 3
Top 20 Unionized Occupations for Black Workers, 2010-2015
(unionized employees as a percent of total occupational employment)
| 1 | Education, Training, and Library Occupations | 35.1 |
| 2 | Protective Service Occupations | 30.6 |
| 3 | Installation, Maintenance, and Repair Occupations | 20.9 |
| 4 | Construction and Extraction Occupations | 20.2 |
| 5 | Community and Social Service Occupation | 19.7 |
| 6 | Transportation and Material Moving Occupations | 18.7 |
| 7 | Healthcare practitioner and technical Occupations | 17.1 |
| 8 | Production Occupations | 15.9 |
| 9 | Life, Physical, and Social Science Occupations | 14.6 |
| 10 | Office and Administrative Support Occupations | 14.0 |
| 11 | Building and Grounds Cleaning and Maintenance Occupations | 13.9 |
| 12 | Architecture and Engineering Occupations | 13.0 |
| 13 | Healthcare Support Occupations | 12.9 |
| 14 | Arts, Design, Entertainment, Sports, and Media Occupations | 10.8 |
| 15 | Personal Care and Service Occupations | 10.2 |
| 16 | Legal Occupations | 9.6 |
| 17 | Busineses and Financial Operations Occupations | 9.4 |
| 18 | Management Occupations | 9.0 |
| 19 | Farming, Fishing, and Forestry Occupations | 8.3 |
| 20 | Computer and Mathematical Science Occupations | 7.9 |
Source: Authors’ analysis of CPS ORG data.
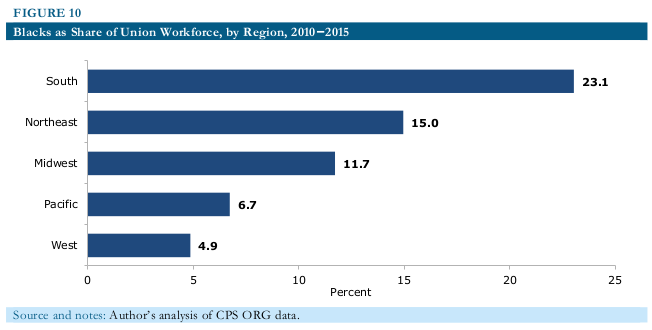
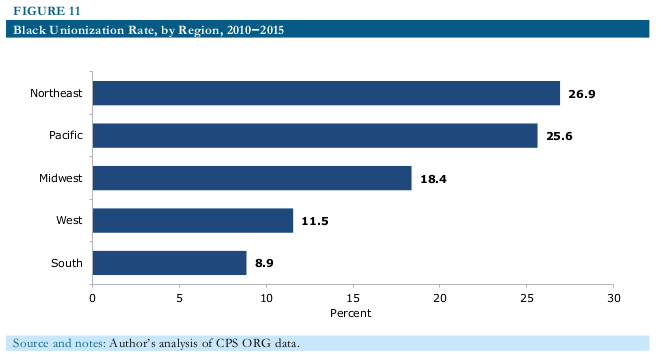
In the south, Blacks made up 17.9 percent of the total workforce, and 23.1 percent of the overall union workforce (Figure 10).3 However, only 8.9 percent of Black workers in the south are represented by a union (Figure 11). Black workers in the northeast and pacific regions are much more likely than those in the south to be unionized, with unionization rates of 26.9 percent and 25.6 percent in the northeast and pacific, respectively.
The Union Advantage for Black Workers
On average, Black union workers have higher wages and better access to health and retirement benefits than their non-union peers.
Wages
As Table 4 shows, during the period from 2010 to 2015, Black union workers on average earned $24.24 per hour, compared to $17.78 for their non-union counterparts, which translates to union workers earning about 36 percent more. Among Black women, union workers earned 37 percent more than non-union workers ($23.18 per hour, compared to $16.92 per hour). Black male union workers earned about 35 percent more than their non-union peers ($25.38 per hour, compared to $18.87 per hour). Only 11.4 percent of Black workers in low-wage occupations were represented by unions, but those that were made on average 39 percent more than non-union Black workers in low-wage occupations ($15.60 per hour, compared to $11.25 per hour).4
TABLE 4
Wages, Health, and Retirement Coverage for Black Workers, 2010-2015
| Unionization rate (percent) | Mean hourly wage (2015 dollars) | Health-insurance (percent) | Retirement plan (percent) | |||||||
|---|---|---|---|---|---|---|---|---|---|---|
| Union | Non-union | Union | Non-Union | Union | Non-Union | |||||
| All | 14.6 | 24.2 | 17.8 | 71.4 | 47.7 | 61.6 | 38.2 | |||
| Women | 13.7 | 23.2 | 16.9 | 69.8 | 46.9 | 61.1 | 38 | |||
| Men | 15.7 | 25.4 | 18.9 | 73.2 | 48.7 | 62.3 | 38.4 | |||
| In low-wage occupations | 11.4 | 15.6 | 11.3 | 53.3 | 31.9 | 38.9 | 22.8 |
Notes: Author’s analysis of CEPR extract of the Current Population Survey Outgoing Rotation Group (CPS ORG) and March CPS. Wage data exclude imputed values. Union refers to union membership or representation. Health insurance refers to participation in an employer- or union-sponsored plan where the employer pays some or the entire premium. Retirement plan refers to participation in an employer- or union-sponsored plan, with or without employer contribution. Health and retirement coverage refer to 2009-2014; wages refer to 2010-2015.
The data in Table 4, however, do not account for underlying differences between union and non-union Black workers. As the previous section has shown, unionized Black workers tend to be older, have more years of formal education, and are more likely to live in higher-wage states and work in higher-wage industries. Therefore, Table 5 uses standard regression techniques to control for these differences, and presents the union advantage for Black workers.
Even after controlling for these fundamental differences between the union and non-union workforce, the union wage advantage remains practically large and statistically significant. For Black workers overall, unionization raises wages on average by 16.4 percent. For a Black worker earning the average non-union wage, this translates to about $2.92 per hour. For Black women, the regression-adjusted union wage advantage is 13.6 percent, and for Black men it is 19.3 percent. Black workers in low-wage occupations have a union wage advantage of 18.9 percent.
TABLE 5
Regression-Adjusted Union Wage, Health, and Retirement Advantage for Black Workers, 2010-2015
| Hourly wage | Health-insurance | Retirement plan | |||||||
|---|---|---|---|---|---|---|---|---|---|
| Unionization rate (percent) | Union premium (percent) | Union premium (percentage points) | Coverage increase (percent) | Union premium (percentage points) | Coverage increase (percent) | ||||
| All | 14.6 | 16.4 | 17.4 | 36.5 | 18.3 | 48 | |||
| Women | 13.7 | 13.6 | 16.5 | 35.1 | 14.3 | 37.6 | |||
| Men | 15.7 | 19.3 | 19.2 | 39.4 | 24.2 | 63.1 | |||
| In low-wage occupations | 11.4 | 18.9 | 13.1 | 41 | 15.4 | 67.5 |
Notes: Author’s analysis of CEPR extract of the Current Population Survey Outgoing Rotation Group (CPS ORG) and March CPS. Regressions include controls for age, age squared, education (LTHS, high school, some college, college, and advanced), gender (when men and women appear in the same regression), state, and two-digit industry. The wage regressions use ordinary least squares and the health and retirement regressions are probits. Union wage premiums in percent are converted from log points by taking the antilog of regression coefficients and subtracting 1. Union health insurance and retirement coverage figures are percentage point increases associated with union coverage. Coverage increases in percent terms are relative to the current coverage rates for non-union workers. Health and retirement coverage refer to 2009-2014; wages refer to 2010-2015. All regression results are significant at the one percent level.
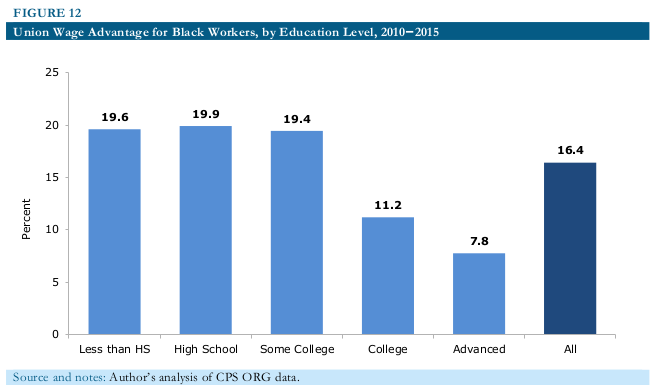
Figure 12 shows the union wage advantage for Black workers by education level, using the same statistical method used in Table 5. The union wage advantage is higher for Black workers with less years of formal education. On average, Black union workers with less than a high school degree earn 19.6 percent more than their non-union peers. The wage advantage for Black workers with bachelor’s or advanced degrees is much smaller at 11.2 percent and 7.8 percent, respectively.
Health Insurance Benefits
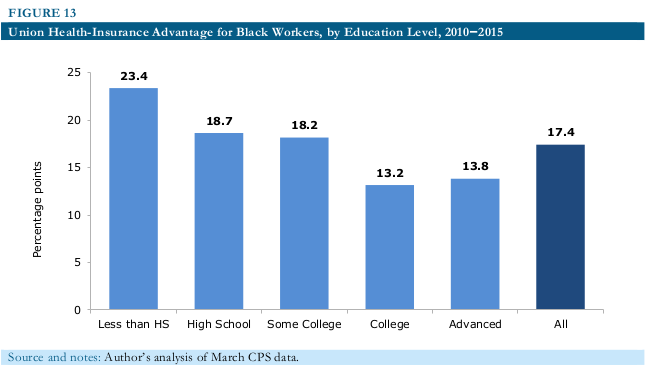
In addition to higher wages, Black union workers are also much more likely than non-union workers to have employer-provided health insurance (Table 4). From 2009-2014, 71.4 percent of Black union workers had employer-provided health insurance, compared to 47.7 percent of non-union Black workers. For Black workers in low-wage occupations, 53.3 percent of those who work under union contracts had health insurance, while only 31.9 percent of those without a union contract had health insurance.
After controlling for differences in education level, age, state of residence, and industry, unionized Black workers were still 17.4 percentage points more likely than their non-union peers to have health insurance (Table 5). For Black workers in low-wage occupations, the union health insurance advantage was 13.1 percentage points.
These union effects vary greatly by education level. Black workers with the least years of formal education benefit the most from union representation (Figure 13). Black union workers with less than a high school degree were 23.4 percentage points more likely than their non-union counterparts to have employer-provided health insurance. Black union workers with bachelor’s and advanced degrees were 13.2 percentage points and 13.8 percentage points more likely to have health insurance, respectively.
In addition to being more likely to offer health insurance, union employers usually cover a higher percentage of the health insurance premium than non-union employers. According to data from the National Compensation Survey, in March 2016, union employers paid about 87 percent of the total single coverage health insurance premium for their employees, while non-union employers were responsible for 79 percent of the premium for their workers. Union employers also paid 80 percent of the total family coverage health insurance premium, and non-union employers paid 65 percent.5
Retirement Benefits
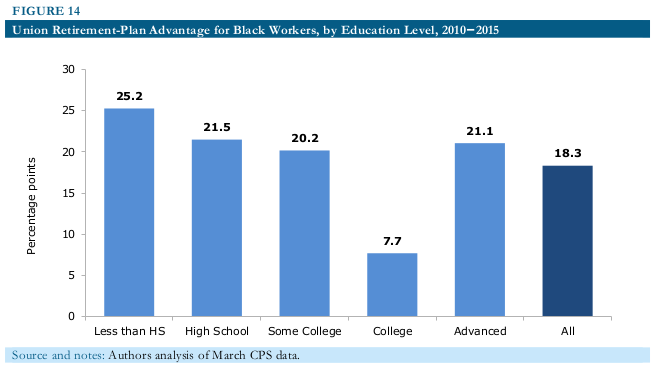
From 2009-2014, 61.6 percent of Black union workers participated in an employer-sponsored retirement plan, compared to 38.2 percent of non-union Black workers (Table 4). Black workers in low-wage occupations are much less likely to participate, with 38.9 percent of those in unions and 22.8 percent of those not in unions participating in an employer-sponsored retirement plan.
After controlling for worker characteristics associated with union status, the union retirement plan advantage remains strong. On average, Black union workers were 18.3 percentage points more likely to have an employer-sponsored retirement plan (Table 5). The effect was even larger for Black men (24.2 percentage points).
Like with wages and health insurance coverage, Black union workers’ retirement plan advantage is also highest for those with the least years of formal education. Black union workers with less than a high school degree were 25.2 percentage points more likely than similar non-union workers to have a retirement plan (Figure 14). For those with bachelor’s degrees, the advantage was 7.7 percentage points, and for those with advanced degrees it was 21.1 percentage points.
Unions and Wage Inequality
The benefits mentioned in the previous sections do not occur in isolation. Despite a long history of discriminating against Blacks, prior research has shown that unions over the past few decades have been an important tool in combating overall wage inequality, and the Black-white wage gap in particular.6 Unions achieve this by standardizing wage rates among workers in similar positions and narrowing gaps between workers with disparate skill levels.7
The deunionization that has occurred over the past thirty years has occurred alongside and contributed to a rise in U.S. wage inequality. Levy and Temin (2007) have argued that “the declining bargaining power of the average worker has resulted in two observable changes: a shift of income from labor to capital and a shift of both labor and capital income to the top of the income distribution.” 8
Researchers have previously attempted to decompose the causes of rising wage inequality. Western and Rosenfeld (2011) found that deunionization accounts for about one-fifth of the increase in wage inequality among women and about one-third of the increase among men from 1973 to 2007. Furthermore, they found that “the decline of the U.S. labor movement has added as much to men’s wage inequality as has the relative increase in pay for college graduates.” 9
Unions also help to combat the Black-white wage gap. Rosenfeld and Kleykamp (2012) have documented the importance of unions in reducing the Black-white wage gap. In their paper, they used regression techniques to calculate what the Black-white wage gap in the private sector would be if race-specific unionization rates had remained at their peaks for women (in 1979) and men (in 1973). According to their data, in 2007, the Black-white wage gap would have been 13 percent lower had deunionization not occurred. Deunionization has especially exacerbated racial wage inequality among women, resulting in a 28 percent higher pay gap in 2007 than there would have been if racial unionization rates for women had remained at 1979 levels. The corresponding number for men was three to four percent.
Conclusion
The data in this report show unequivocally that unions raise the wages of Black workers and increase their access to health and retirement benefits. Union representation boosts the wages of Black workers by 16.4 percent. Black union workers are also 17.4 percentage points more likely to have employer-provided health insurance, and 18.3 percentage points more likely to have employer-sponsored retirement plans than their non-union peers.
Black union workers in low-wage occupations enjoy an even higher wage advantage from unionization, with hourly wages that are 18.9 percent higher than their non-union counterparts. They are also 13.1 percentage points more likely to have employer-provided health insurance and 15.4 percentage points more likely to have employer-sponsored retirement plans. Also, Black union workers with less than a high school degree have a wage advantage of about 20 percent, and are 23.4 percentage points more likely to have health insurance and 25.2 percentage points more likely to have a retirement plan.
Despite these clear benefits of unionization, decades of anti-union policy decisions have resulted in a tenuous environment for collective bargaining. Over the past three decades, the Black unionization rate has dropped 56 percent (from 32 percent in 1983 to 14 percent in 2015), while the overall unionization rate has fallen 48 percent (from 23 percent in 1983 to 12 percent in 2015).
Prior research has shown that deunionization has contributed to a rise in overall wage inequality as well as a widening of the Black-white wage gap. Better protection of collective bargaining rights going forward will help to ensure that all workers and Black workers in particular will continue to benefit from unionization’s effectiveness in combatting inequality.
References
Bureau of Labor Statistics. 2016. “Employee Benefits in the United States – March 2016.” Washington, D.C.: U.S. Department of Labor, Bureau of Labor Statistics. http://www.bls.gov/news.release/pdf/ebs2.pdf.
Freeman, Richard B. 1980. “Unionism and the Dispersion of Wages.” Industrial and Labor Relations Review, Vol. 34, No. 1, pp.3-23.
Freeman, Richard B. 1982. “Union Wage Practices and Wage Dispersion within Establishments.” Industrial and Labor Relations Review, Vol. 36, No.1, pp. 3-21.
Hirsch, Barry T. 2004. “Reconsidering Union Wage Effects: Surveying New Evidence on an Old Topic.” Journal of Labor Research, Vol. 25, No. 2, pp. 233-266.
Hirsch, Barry T., and Edward J. Schumacher. 2004. “Match Bias in Wage Gap Estimates Due to Earnings Imputation.” Journal of Labor Economics, Vol. 22, No. 3, pp. 689-722.
Lemieux, Thomas. 2008. “The Changing Nature of Wage Inequality.” Journal of Population Economics, Vol. 21, No. 1, pp. 21-48.
Levy, Frank, and Peter Temin. 2007. “Inequality and Institutions in 20th Century America.” Cambridge, MA: National Bureau of Economic Research. Working Paper No. 13106. http://www.nber.org/papers/w13106.pdf.
McCall, Leslie. 2001. “Sources of Racial Wage Inequality in Metropolitan Labor Markets: Racial, Ethnic, and Gender Differences.” American Sociological Review, Vol. 66, No. 4, pp. 520-541.
Rosenfeld, Jake, and Meredith Kleykamp. 2012. “Organized Labor and Racial Wage Inequality in the United States.” American Journal of Sociology, Vol. 117, No. 5, pp. 1460-1502.
Schmitt, John, Margy Waller, Shawn Fremstad, and Ben Zipperer. 2007. “Unions and Upward Mobility for Low-Wage Workers.” Washington, DC: Center for Economic and Policy Research. https://cepr.net/documents/publications/unions-low-wage-2007-08.pdf.
Western, Bruce and Jake Rosenfeld. 2011. “Unions, Norms, and the Rise in U.S. Wage Inequality.” American Sociological Review, Vol. 76, No. 4, pp. 513-537.
Data Appendix
This report analyzes data from consecutive years of the Current Population Survey (CPS). The CPS is a monthly survey of about 60,000 households, designed to be representative of the civilian non-institutional population in the U.S.
Wages
The wage analysis in this paper uses hourly wages from CEPR’s extract of the 2010-2015 merged CPS Outgoing Rotation Group (ORG) data. The CPS ORG consists of the subset (one-fourth) of the total CPS sample who are asked detailed questions about their labor market experience the week prior to being interviewed. Imputed wages are excluded from this analysis, following evidence from Hirsch and Schumacher (2004) that including imputed wages would bias union wage gap estimates toward zero.
Health Insurance
Health insurance data come from six years of data from the March supplement to the CPS. The March CPS asks respondents about their health insurance coverage during the preceding calendar year, so health insurance data in this report refer to 2009-2014. This paper defines workers as having health insurance coverage if their employer or union provided health insurance and paid all or part of the insurance premium.
Retirement Plan
The March CPS also asks respondents if they participated in an employer- or union-sponsored retirement plan during the previous calendar year. They survey does not ask if the employer contributes to the plan, so the data in this paper defines workers as having a retirement plan if they participated in any employer-provided retirement plan regardless of whether their employer contributed to the plan. As with the health insurance data, the retirement plan coverage refers to 2009-2014.
Union
In addition to asking respondents about their wages, the CPS also asks them about their union affiliation. This paper defines a union worker as someone who is either a member of or represented by a union at their current place of work. Absent March CPS data on union affiliation in the previous calendar year, this report instead uses union status at their current job for our analysis of health and retirement coverage. This presents two issues. First, the March CPS union data come from the ORG fielded in the same month, reducing the full March CPS by one-fourth and making estimates less precise. Second, measurement error occurs as a result of using current union status as a proxy for union status in the preceding calendar year, which biases the regression coefficients on health and retirement coverage toward zero.
Low-wage Occupations
Using CPS data, we analyze unionization trends within the following 15 low-wage occupations: food preparation and serving workers, cashiers, cooks, child care workers, packers and packagers, maids and housekeeping cleaners, personal and home-care aides, stock clerks, janitors, grounds maintenance workers, teacher assistants, laborers and freight workers, nursing, psychiatric and home health aides, security guards, and first-line supervisors of food prep and serving workers. These occupations were chosen according to the criteria used by Schmitt, Waller, Fremstad, and Zipperer (2007). The first criterion is that the occupation had to account for at least 0.25 percent of the total workforce in the combined 2010-2015 CPS ORG. Second, the occupation had to have a unionization rate equal to or above 5.0 percent. The 15 occupations with the lowest non-union median wage meeting these two stipulations were chosen. The three lowest food preparation-related occupations were combined.
Region
The Northeast is Maine, New Hampshire, Vermont, Massachusetts, Rhode Island, Connecticut, New York, New Jersey, and Pennsylvania; the Midwest is Ohio, Indiana, Illinois, Michigan, Wisconsin, Minnesota, Iowa, Missouri, North Dakota, South Dakota, Nebraska, and Kansas; the South is Delaware, Maryland, District of Columbia, Virginia, West Virginia, North Carolina, South Carolina, Georgia, Florida, Kentucky, Tennessee, Alabama, Mississippi, Arkansas, Louisiana, Oklahoma, and Texas; the West is Montana, Idaho, Wyoming, Colorado, New Mexico, Arizona, Utah, and Nevada; the Pacific is Washington, Oregon, California, Alaska, and Hawaii.
Data
The underlying CPS ORG and March CPS data used in this report are available at http://ceprdata.org. Table A1 below displays the sample sizes for the regressions in Table 5.
TABLE A1
Sample Sizes for Regressions in Table 5.
| CPS ORG | March CPS | ||||
|---|---|---|---|---|---|
| Wages | Health Insurance | Retirement Plan | |||
| All | 52910 | 6740 | 6714 | ||
| Women | 29988 | 3822 | 3798 | ||
| Men | 22922 | 2906 | 2900 | ||
| In low-wage occupations | 14167 | 1698 | 1680 |
Notes: Author’s analysis of CEPR extract of the Current Population Survey Outgoing Rotation Group (CPS ORG) and March CPS, 2010-2015.
1 This paper defines a union worker as someone who is either a member of or represented by a union at their current place of work.
2 See the Data Appendix for details on the data used in this report.
3 See the Data Appendix for a complete list of states by region.
4 See the Data Appendix for details on the low-wage occupations analyzed in this report.
5 BLS (2016).
6 For more on unions and their effects on inequality, see Freeman (1980), Freeman (1982), Hirsch (2004), Lemieux (2008), and McCall (2001).
7 Freeman (1980).
8 Levy and Temin (2007), p. 37.
9 Western and Rosenfeld (2011), p. 532.