Report
The AI Bubble Monitor
Report
Is there an AI bubble? Some key indicators point to one — and when bubbles burst, there can be massive shocks in the housing and job markets that last for years. This weekly tracker will compare current trends on Wall Street with historical averages.
The AI Bubble Monitor #6: July 13, 2026
AI Sales: Going the Wrong Direction
This is going to be a short one; it’s a busy weekend for me.
First, the latest price-to-earnings numbers and market capitalization for the big AI-focused companies.
I was struck by a graph showing OpenRouter’s measure of AI usage this year. (It appears in a newsletter published by Deutsche Bank’s chief economist, Jim Reid.)
There are two striking features to the graph. The first is that usage of Chinese AI passed the usage of US AI in the last week of May. This had also happened for the last week in March, but the US went back into the lead in April. However, this time around the Chinese models extended the lead through June so that for the first week in July they look to be about 40 percent higher. That might be great news for Chinese AI, but not so good for US makers.
The other feature to the graph that is even more striking is that usage of US models actually fell in the most recent week. The story of a huge AI boom is usage rising at an extremely rapid, and maybe even increasing, pace. A decline in usage is not supposed to be in the cards.
To be clear, this is just one week and perhaps there were unusual factors that depressed AI usage in the first week in July, like the holiday. But even if the one-week fall can be dismissed, total usage was roughly back to where it was four weeks ago, as there was very little growth in the prior two weeks. That is clearly not a story of an AI boom, or at least a boom in US AI. We have to wonder how many weeks of weak sales will it take before some of the big AI investors get worried?
If there is any possibility that the massive investments of the AI companies will pay off, usage has to increase hugely from current levels. The fact that it levels off for even a short period should be concerning, as should the rapid growth in the usage of Chinese AI. The US companies have to both be able to sell a huge amount of their AI and they also have to be able to sell it at a high price. Chinese AI that is comparable in quality for most uses and sells for a fifth or even a tenth the price will pose a serious obstacle.
It may seem hard to imagine that people who manage tens (or even hundreds) of billions of dollars in pension funds or hedge funds can be totally clueless about the market prospects for the companies on which they are placing big bets. But the housing bubble wasn’t that long ago.
Back then, huge funds were prepared to believe that securities that were backed by subprime mortgages, often made with no money down, were a safe bet. And AIG, the largest insurer in the world, was prepared to back up these bets with hundreds of billions of dollars in credit default swaps. When the bubble burst, its bankruptcy was a certainty had it not been for a massive government bailout.
And it was only four years ago that the geniuses who ran Silicon Valley Bank had to be taught that the value of bonds falls when interest rates rise. Of course, they also got a government bailout, so maybe that is the lesson the big money folks learned.
Anyhow, it would be good if we could get the rich to show a little respect for the market. If the AI bubble bursts, there should be some real career consequences for the folks who lost tens of billions for their clients — no “Who could have known?” amnesties. And no government bailouts for the swashbuckling AI barons. Let them eat their losses.
The AI Bubble Monitor #5: July 6, 2026
Here are the most recent numbers:
Fans of an AI-driven stock boom should be aware that they are making three big bets, all of which are far from certain.
1) The first is that productivity growth will soar to rates never seen before. Unless there is an unprecedented further redistribution from wages to profits, which are already at a near-record share of GDP, the only way profits can rise enough to make sense of current share prices would be for productivity to grow in a 4-5 percent range.
2) The second bet is that AI companies will be the main beneficiaries of higher productivity in the form of higher profits. This assumes that competition will not drive down prices to limit profits. If that sounds far-fetched, this is what happened with the Internet. Leading internet providers like Verizon and Comcast are large, profitable companies, but they only have a tiny fraction of the gains society has received from the Internet. It is possible to imagine a comparable story with AI, where there are large benefits, but the major AI companies end up with relatively modest profits since competition forces down prices.
3) The third bet is closely related to the second one: that US AI companies will capture the bulk of the profits. As I noted a couple of months ago, the AI provided by Chinese companies almost matches the cutting-edge US models on technical standards but sells for one-fifth or even one-tenth the price charged by US companies.
This is the reason China has a large and rapidly growing share of the world AI market. If Chinese AI makers are able to gain a large share of the benefits of the technology, it will leave less for US producers. Perhaps more importantly, Chinese AI makers can provide the competition that depresses prices, even if US antitrust policy is too weak to do so.
But the first question is simply whether there will be the big productivity surge that creates the benefits to be divided. And that story is not looking very good just now.
Just to back up for a moment, productivity is the value of output that an average worker produces in an hour of work. If productivity were to double, it would mean they produce twice as much output per hour. Instead of producing one pair of shoes in an hour, if productivity doubled a worker could now produce two pairs of shoes.
In the real world, the story is considerably more complicated, since we produce much more than shoes, but this is the basic story. However, instead of trying to measure output of a single product, we measure all the goods and services produced in the economy. And we adjust for inflation. We’re interested in the extent to which we’re actually producing more goods and services in an hour of work, not the extent to which prices have risen.
As I have pointed out before, any story where current valuations of tech and AI companies — and indeed the stock market as a whole — make sense has to assume that productivity growth will soar. Instead of having the 1.5-2.0 percent growth we’ve seen in recent years, we would need productivity growth of 4.0-5.0 percent a year to allow profits to grow enough to provide the sort of returns that stock investors have historically expected.
This sort of productivity growth would also imply something like the rapid displacement of workers by AI that concerns people. At a 4 percent growth rate, it would take roughly 18 years for workers’ productivity to double. At a 5 percent growth rate the doubling would occur after 14 years. Even this pace of productivity growth may not mean the sort of mass layoffs that people fear, but it would lead to an extraordinary transformation of the workplace and society.
And to be clear, this is an economy-wide average, not a specific industry. There are stories (maybe invented) of software makers cutting their staff by 50,60, or 70 percent because AI is now doing the work. There could be specific industries where this is the case, but getting economy-wide productivity gains means that we have to be seeing benefits everywhere, including sectors like hotels and restaurants, hospitals, retail outlets, hair salons, and just about everywhere else. Alternatively, the gains in the sectors where AI is affecting productivity have to be massive.
It is also important to recognize that there are sure to be negatives, where AI requires additional labor, just as has been the case with computers and the Internet. We had no need for virus detection and computer repair before we had the Internet and computers.
There are a wide range of estimates of the likely impact of AI on productivity growth, and they don’t tell the story of the sort of massive uptick that would justify current stock prices. Torsten Slok, the chief economist for Apollo Global Management, compiled a list of academic studies on the productivity impact of AI.
The most optimistic was by Antonin Bergeaud. It showed an increase in annual productivity growth of 0.3-0.6 percentage points, with a cumulative gain of 6-12 percent, which would be realized over 10-20 years. That is a good story, but hardly game-changing in terms of what we should expect from the economy.
The most pessimistic assessment came from Nobel Prize-winning economist Daren Acemoglu. He put the annual gain at 0.07 percentage points, with a cumulative productivity gain of 0.7 percent after 10 years. There is always a lot of uncertainty with these sorts of projections, but it is striking that the economists who have tried to look at the issue closely do not see an enormous productivity impact, and none of them see anything like the job apocalypse that is bantered about in political conversations about AI.
Finally, we can look at the data we have to date for an AI-driven productivity uptick. Thus far, we aren’t seeing it. The graph shows moving five-year average rates of productivity growth. The reason for taking a five-year average is to smooth out the effects from unusually bad or good quarters.
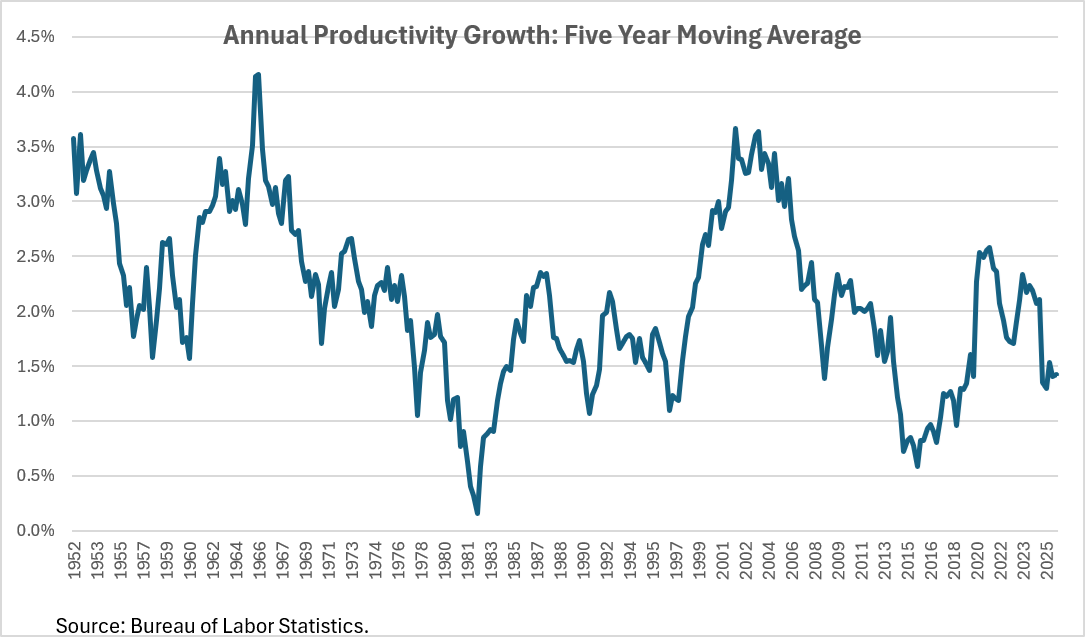
As can be seen, the recent years don’t look especially good. There was a period where the average just crossed 2.5 percent around the pandemic, before slumping again. We got back over 2.0 percent in 2023 and 2024, where there may have been some AI impact, but recently productivity growth has slumped again. The average for the last three quarters has been just 1.1 percent. (I’m assuming a 1.3 percent rate for the second quarter based on hours growing at a 1.3 percent rate and expected GDP growth close to 2.5 percent.)
It’s worth noting that even the best stretch of the recent past doesn’t come close to reaching the rates of over 3.5 percent seen at the peak of the Internet boom or the 3.0 percent growth seen through much of the 1950s and 1960s. In short, the data to date give us no reason to believe the productivity impact of AI will be earth-shaking.
It’s also worth noting that at the point where the 1990s stock bubble was hitting its peak in March of 2000, the productivity pickup had been going on for more than four and a half years. Perhaps we will still see a big uptick in productivity growth from AI, but it’s clear that in this case the stock market is way ahead of where it was in the 1990s bubble. That should not be reassuring.
The AI Bubble Monitor #4: June 29, 2026
First things first, here are the price-to-earnings ratios for key AI stocks as of last Friday (June 26), and their market capitalization:
I was going to write about productivity growth and AI this week, but I saw this Paul Krugman piece and I thought it was worth doing a detour back to Elon Musk. Just to remind everyone, I am not just arbitrarily picking on everyone’s favorite ketamine-addled semitrillionaire. SpaceX is first and foremost an AI company, according to its own registration statement. It sees more than 90 percent of its future market in AI. With SpaceX’s market capitalization hovering near $2 trillion, Elon Musk’s travails are very much relevant to the course of the AI bubble.
Musk was in the news for a number of reasons last week. He was angrily insisting his DOGE team’s destruction of USAID — feeding it into the wood chipper, as he eloquently phrased it — didn’t lead to any deaths. Since the program had provided nutrition and essential medicines for millions of people, this seemed a tall tale even by Trumpian standards.
But the more immediate issue for the future of SpaceX is that the value of the $25 billion in bonds it sold the prior week fell by $305 million, or 1.2 percent. This raises two big questions. The first is why SpaceX feels the need to borrow money at all. It can and did raise an enormous amount of money by selling shares. Only a bit more than 4.0 percent of SpaceX’s shares are now public, which should mean in principle that it can raise a huge amount of money by selling off more shares. For some reason, it has apparently chosen not to go that route.
Even more noteworthy than Musk’s odd financing choice is the fact that the market seems to be souring on SpaceX bonds. While there is plenty of overlap between investors in stocks and bonds, they are not entirely the same people. Elon Musk groupies are far more likely to be found holding SpaceX stock than SpaceX bonds.
More importantly, the nature of the bet investors place in the bond market is qualitatively different than the bets they are placing in the stock market. The bet in the bond market is simply that the company will be able to pay its bills. If SpaceX’s $25 billion in bonds were issued at a 5 percent interest rate, bondholders are betting that it will be able to pay out $1,250 million a year for the life of the bonds and then pay back the bond in full at its expiration date. If the company becomes insanely profitable, the bondholder still only gets the contracted interest rate.
By contrast, the bet on SpaceX stock is that the company will become insanely profitable. As I pointed out in my earlier piece, its current market capitalization would imply that shareholders expect the company to have around 20 percent of all after-tax corporate earnings, based on current GDP growth projections.
I actually should qualify that comment slightly. Some SpaceX investors may actually believe that the company will become insanely profitable. However, many investors may have no confidence whatsoever in Elon Musk or SpaceX. They may just believe that there are enough Elon Musk groupies to continue to drive up the share price to ever more absurd levels, which will allow them to sell at a healthy profit before reality catches up with the company and its share price collapses.
But the betting in the bond market is a different story. For some reason, investors holding SpaceX bonds, or thinking of buying into them, became less confident last week that the company will be able to pay its bills for the duration of the bonds. I confess to not having studied SpaceX closely but given that it currently is losing money hand over fist, that seems a reasonable concern.
Also, since Musk’s business model seems to depend on having a close political ally in power to steer government contracts in his direction and override laws and regulations for his benefit, the ability of SpaceX to repay bonds will fall sharply if Trumpers lose control of the Congress and the White House. For these reasons, it is understandable that investors in the bond market have concerns about SpaceX’s ability to pay its debt.
In any case, it is striking that on the one hand there are investors in the stock market betting that SpaceX will be the most profitable company in the history of the world, while investors in the bond market are questioning whether it will be able to stay out of bankruptcy.
The AI Bubble Monitor #3: June 22, 2026
Here are the price-to-earnings ratios as of Friday, June 19. At 37.16, the average increased slightly over last week.
Most of us tend to think that the people controlling billions, or even hundreds of billions of dollars, at major corporations have a pretty good idea of what they are doing with their companies’ money. But that clearly is not always the case.
For example, in 2000, Time-Warner, which was at the time the largest media company in the country, effectively sold itself for nothing to AOL. The sale went through just two months before the peak of the 1990s tech bubble and the beginning of the crash. AOL was one of the high-flyers of the bubble, with a market capitalization of more than $200 billion, which would be around $400 billion in today’s dollars.
AOL paid for Time-Warner with $165 billion of its own stock. Shortly after the merger, the stock of the combined company plunged to roughly what would have been the value of Time-Warner’s stock if it remained an independent company. AOL’s business was adding virtually nothing.
There are numerous other stories of extraordinarily bad business judgement from the tech bubble era. As I’ve mentioned before, many companies discovered that adding “dot.com” to their name was an effective way to juice their stock price.
Bad business judgement did not go out of style with the collapse of the tech bubble. Meta lost as much as $80 billion pushing its Metaverse, which it largely abandoned at the end of last year. There is some question as to how much of this is actually a loss, since some of the spending may ultimately pay a dividend with AI, but it’s clear a large share of this investment was seriously misdirected.
This background is worth mentioning when it comes to the AI bubble, since a key question is this: How much are businesses willing to pay for AI? Until recently, AI enthusiasts were touting the rapid growth in revenue. It seems a big factor in that growth was companies spending money on AI, even if they didn’t have a productive use for it, because they thought it meant their companies were at the cutting edge in technology.
That sounds crazy, but even large companies can often do things that are pretty crazy, as noted above. In recent weeks there have been several reports in the media of companies “tokenmaxxing,” where companies rewarded mid-level workers for using AI. This was not just small or midsize companies with poor management. Amazon, one of the largest companies in the world, had an AI leaderboard for their workers, where they could be rewarded for the amount of AI they used. Other companies were following similar practices.
Apparently, companies are now looking at their AI bills and deciding that it may not be the smartest thing in the world to encourage employees to use AI as an end in itself. This is at the least likely to mean slower growth in AI usage, if not actually reduced usage in many companies.
The change in attitudes may also lead to more cost-consciousness in choices of AI systems. This is where Chinese AI may come to be a bigger factor. If companies were just using AI to be cool, it is easy to go with the leading American companies, which would generally be Anthropic and OpenAI. The systems produced by these companies generally rank at or near the top by most measures.
But they cost considerably more than the Chinese systems, the best of which are not far behind according to most ratings. To take a few illustrative examples, the cutting-edge Anthropic system costs $15 for 1 million output tokens. The leading OpenAI model charges $30, while Google’s frontier model costs $9 for 1 million tokens.
By comparison, the leading model from Minimax costs just $2 per million output tokens, while Moonshot charges $3.00. Alibaba has a discount version available for just 60 cents per million output tokens. (Input tokens tend to cost around 20 percent as much, but the pricing follows the same pattern.)
These comparisons are not comprehensive. The US makers offer older versions at somewhat lower prices and there are many more Chinese AI makers than just the three listed here. This is another advantage that China has. It has around a dozen highly competitive AI makers, while the US has just five.
If AI consumers become more cost-conscious then they are likely to increasingly turn to Chinese AI companies. This will be the case even if the US producers can maintain a modest lead in producing cutting edge AI. The vast majority of users are not going to need cutting edge AI, just as the vast majority of computer users do not have any use for the top-of-the-line models produced by Dell or Apple.
The Chinese AI also has the advantage that it is mostly open weight. This means that users can modify the models to better fit their needs. It also means that the systems can be downloaded and run on a company’s own computers. This allows companies to protect their data; they need not fear that they are handing it over to the Chinese government, although they may be handing it over to Elon Musk or Mark Zuckerberg with the US systems.
The lower cost and open-weight systems are a reason that Chinese AI is gaining ground around the world and even in the United States. According to data from OpenRouter, four of the top five models for worldwide usage in May were Chinese companies. Much of this usage is in China or in third countries; however, the cost advantage is also causing Chinese AI makers to gain ground in the United States.
And it is not just small companies looking to skimp on costs that are turning to Chinese AI. Airbnb relies on Alibaba’s Qwen model because it is “fast and cheap.” Unless there is some big roadblock put in their path, it seems likely that the Chinese AI share of the US and world market is likely to grow in the months and years ahead.
It is also important to note that even insofar as the US producers can retain their market, the low-cost Chinese competition will depress profit margins. It’s hard to sell a car for $40,000 if a comparable model is available for $4,000.
Similarly, unless there is some massive productivity benefit from using US AI as opposed to Chinese models, it is difficult to see why companies would pay $15 to $30 for 1 million output tokens when they can pay top-line Chinese companies $2-$3 for a million tokens.
One other factor to take into account in the international competition is that Donald Trump has decided to take a direct interest in promoting US AI over the Chinese producers. Ordinarily having a helping hand from the government might be seen as a plus in international competition, But this is not a story where the Commerce Department or other government agencies will be relying on people familiar with the industry to devise ways to favor US firms.
This is a story where Donald Trump will be looking to favor the companies where the CEOs and other top executives have curried his favor and/or made large contributions to his various collection plates. He will also be looking to harm companies that may have done something to warrant his wrath, as recently seems to have been the case with Anthropic.
While both China have many bright and hard-working people in their AI industries, the Chinese producers have the advantage that they don’t have Donald Trump on their side. There are many reasons why it already looked like the competition was going in China’s favor, but Trump might be more than enough to clinch the game.
The AI Bubble Monitor #2: June 15, 2026
Here are the price-to-earnings ratios as of Friday, June 12. At 35.2, the average increased slightly over last week. For reference, the average at the peak of the late ‘90s tech bubble was 43.8.
Figure 1
Last week was a big one for the AI bubble. SpaceX had the largest IPO ever and Elon Musk became the world’s first trillionaire. In fact, it was such a big deal I thought I would summon Mr. Arithmetic out of retirement to get his insights.
First, if anyone is wondering what rockets have to do with the AI bubble, you have to look at the company’s registration statement. It projects that more than 90 percent of its future market ($26.5 trillion of $28.5 trillion) is in AI. So, SpaceX is first and foremost an AI company.
Now, let’s do the numbers. The Friday close on the listed shares for SpaceX’s IPO gave the company an implied market capitalization of $2.2 trillion. Does this valuation make sense?
Ordinarily, we would first look to its price-to-earnings ratio (PE) to see how high it is. But we can’t really do that with SpaceX, since it lost $5 billion last year. So, the company has a way to go here. Clearly the company’s IPO is a bet on Elon Musk.
I know there are some who insist the guy is a visionary and a genius, but his track record has not been great, nor has his relationship with the truth. Paul Krugman gave a few prominent examples of Musk’s boasts that have not panned out in his Friday Substack. His Boring Company, which was supposed to create superfast trains between cities, has literally gone nowhere. The same goes with his Neuralink company that is supposed to give us brain implants that allow us to circumvent our normal physical processes.
He has promised us that Tesla would give us full-self-driving cars next year for at least a decade. And he was supposed to have a full system of self-driving taxis last year. Apparently, Tesla now offers limited service in Austin, Texas. By contrast, Waymo has extensive service in San Francisco, Phoenix, and a number of other major cities.
And for those keeping score on such things, Tesla’s profits were $4 billion last year, roughly 0.25 percent of its market capitalization. And the overwhelming majority of the profits came from selling carbon credits, a system that Musk’s good friend Donald Trump wants to end. In short, Musk’s track record in his business dealings has been less than stellar.
But his ventures into politics look even worse. Apart from his presidential pick (he once said he loves Donald Trump as much as it’s possible to love another man without being gay), his grasp of numbers seems to be seriously lacking. When he was allowed to invent and run a “Department of Government Efficiency” Musk said he would eliminate at least $2 trillion in waste and fraud, according to Grok, his AI system. At one point, he suggested giving us all $5,000 annual DOGE dividends, which would come to over $1.3 trillion a year.
The most cursory examination of the federal budget would have told him that savings of this magnitude are absurd. The whole budget for 2025 was a bit over $7 trillion, with the overwhelming majority going to interest on the debt, Social Security, Medicare and Medicaid, and the military.
Reducing interest payments would mean radically altering monetary policy, which he didn’t have the authority to do, and would be a radical shift, to say the least. Social Security and Medicare have been endlessly scrutinized and found to have very little fraud. Medicaid surely has some, but it is hard to detect and getting to double-digit billions would be a huge stretch — and still less than 1 percent of Musk’s target. Defense surely has fraud and waste, but Musk’s boss didn’t want him to go there.
Spending outside of these areas was well under $2 trillion. This included education, scientific research, infrastructure, the FBI and criminal justice, agriculture, and foreign aid. Musk was able to score big in cutting the last category by cutting around $20 billion (1 percent of his promised savings), leading hundreds of thousands of people in Africa to get sick and likely die from AIDS and now Ebola.
Musk also routinely initiated and/or repeated whack job crazy claims like 20 million dead people getting Social Security. (The true number is low thousands, among a population of 70 million beneficiaries.) He also claimed, against all evidence, that Democrats are arranging to have millions of undocumented immigrants vote.
Maybe Musk never believed such craziness, and these were just lies to advance his political agenda. But if someone would so easily tell whack job crazy lies to advance their political agenda, is it reasonable to think that they wouldn’t tell lies to make themselves richer?
The question of the day: Does SpaceX’s $2.2 trillion market capitalization makes sense? We know the thing doesn’t make money now, but maybe at some point in the future Elon will be raking in the bucks to justify this price.
Let’s say we take a 10-year horizon. In 2036, SpaceX will be 34 years old, a more established company than Google is today, so we might expect it to have profits somewhat in line with its share price, like most mature companies. But its share price should be far higher in 2036 than it is today. After all, people aren’t buying shares of SpaceX to just break even.
Historically, stocks have given somewhere close to a 10 percent nominal return. (I have argued that expecting that return going forward probably doesn’t make sense, but most people invested in this market probably do expect a return something like that.) But that is for a normal stock with real profits. People putting money in SpaceX are betting on a company that is losing large amounts of money and run by a person with an affection for ketamine and neo-Nazi propaganda. Surely, they expect a better return than the measly 10 percent you can get from investing in an airline or consumer products company.
Let’s assume your typical SpaceX investor is expecting a 20 percent annual return. (Use a different number if you prefer.) After ten years with a 20 percent annual return, SpaceX’s market capitalization will be 6.2 times its current level, or $13.6 trillion.
As a mature company, let’s say that in 2036 it will have a price-to-earnings ratio of 20, still well above the long-term average for the stock market. That would imply it would have annual after-tax earnings of $680 billion. Is that plausible?
The Congressional Budget Office (CBO) currently projects that, in the economy as a whole, after-tax corporate profits will be $4.1 trillion in 2036. That would mean that SpaceX will have almost 17 percent of all after-tax corporate profits. That is several times larger than the share that any company has ever had.
It also comes at a time when Musk’s rivals, Open AI and Anthropic, are also having IPOs expected to price them at well over $1 trillion. Don’t forget that Nvidia already has a market cap of almost $5 trillion and the rest of the magnificent 7, including Tesla, all have market caps of well over $1 trillion.
If you think that something here doesn’t add up, you would be right. But there is the possibility that the CBO is wrong — and not just by something like 3-5 percent, which would already be a big deal, but 20 percent, 30 percent or more, which would be huge and unprecedented.
We can’t rule that sort of extreme error out of the realm of the possible, but we can say some things about the world where it is true. Jason Furman, who was a top economic advisor in both the Clinton and Obama administrations, had a New York Times column on Friday warning about the disaster facing Social Security as projections show a funding shortfall beginning in 2032.
While Furman is right that we will need additional funding for Social Security, the concern he expresses at the end for the well-being of our children is utterly absurd if economic growth is going to be hugely faster than the CBO projects, because of the wonders of AI. If the price of SpaceX and other AI companies come anywhere close to making sense, then concerns about the material well-being of future generations are complete nonsense.
Can completely contradictory views of the world exist on opposite sides of the New York Times home page and no one even notices? Having been around Washington policy debates for more than three decades, I can assure people that they can.
The people involved in policy debates tend not to be deep thinkers. They can miss massive contradictions right in front of their face. In fact, the same person can even argue massively contradictory positions themselves and fail to recognize the problem.
What do you know, here’s Elon Musk warning earlier this year that there is a “1000% chance” the government will go bankrupt. Anyone up for some shares in SpaceX?
Figure 2
The AI Bubble Monitor #1: June 8, 2026
The US economy has had two major bubbles in the last three decades. There are signs that we are in the midst of a third.
In the late 1990s there was a tech bubble, driven to a large extent by excitement over the potential of the Internet. This drove stock prices to a peak value of 43.8 times earnings (known as the price-to-earnings ratio, or P/E), according to the calculations of Nobel Prize- winning economist Robert Shiller.
This bubble began to burst in March of 2000. The S&P lost almost 50 percent of its value at its trough two-and-a-half years later in October of 2002. The NASDAQ, which included all the major tech stocks, lost almost 80 percent of its value over this period.
The collapse of the bubble was a huge hit to the economy and the labor market. Measured by output, the recession that took place in 2001 due to the collapse was relatively mild, but measured by employment, it was huge. Job growth turned negative in March of 2001.
The economy did not get back the jobs lost for four full years. This was the longest period without job growth since the Great Depression. The weak labor market also brought the strong real wage growth of the late 1990s to an end, as the real median wage rose less than 1.5 percent from 2001 to 2007, when the next recession hit.
The recovery from the collapse of the tech bubble was driven by the growth of a massive housing bubble, as inflation-adjusted house prices rose by 70 percent from 1996 to 2006, after being roughly flat for the prior century. Over the years from 2007 to 2010, most of this increase was reversed.
The consequences were enormous. Residential construction, which peaked at 6.7 percent of GDP in 2005, fell back to just 2.4 percent of GDP in 2010. This drop of 4.3 percentage points of GDP would be equivalent to losing more than $1.3 trillion in annual demand in today’s economy. The loss of trillions of dollars housing wealth also curtailed consumption.
The impact on the economy was massive, as GDP growth was almost 0 in 2008, and the economy shrank by 2.7 percent in 2009. The unemployment rate peaked at 10.0 percent in October of 2009. Job growth for 2008-10 was more than 12 million below projections. Millions of people also lost their homes.
This recent history is important to keep in mind as we look at the AI bubble. The bubble is arguably even larger relative to the economy than the tech bubble when it peaked in 2000. According to Shiller’s calculations, the PE in the stock market, at 39.6, is slightly lower than it was at the 2000 peak. However, after-tax profits are nearly twice as large a share of GDP than they were in 2000. That means that the value of the stock market relative to the economy is nearly twice as large as it was at the peak of the tech bubble.
The current value of all corporate stock is close to $80 trillion, more than 2.5 times GDP. If PE ratios fell back to their long-term average of just under 20, it would destroy close to $40 trillion in stock wealth, an average of almost $300,000 per household. If the PE fell back to its long-term average, and the after-tax profit share of GDP also fell back toward their level of a quarter-century ago, then the loss of wealth would be even larger.
It is impossible to know the timing for when a bubble will collapse. A quarter of a century later, it is still not possible to identify any event that caused the 1990s tech bubble to collapse. It’s also not clear what caused the housing bubble to stop growing and start deflating.
With that in mind, it is possible to track the bubble, looking at the growth in the prices of the most important stocks and changes in their PE. This is what the AI Bubble Monitor will do on a weekly basis.
Figure 1
Figure 2
Article
Article
Article
Article