Report
May 2012, John Schmitt and Marie-Eve Augier
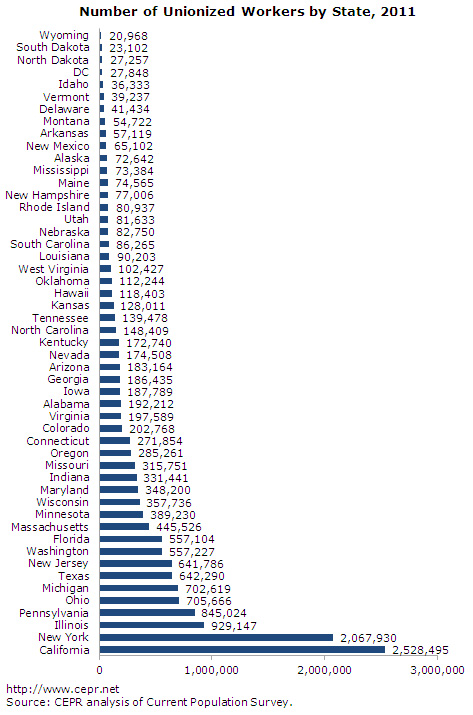
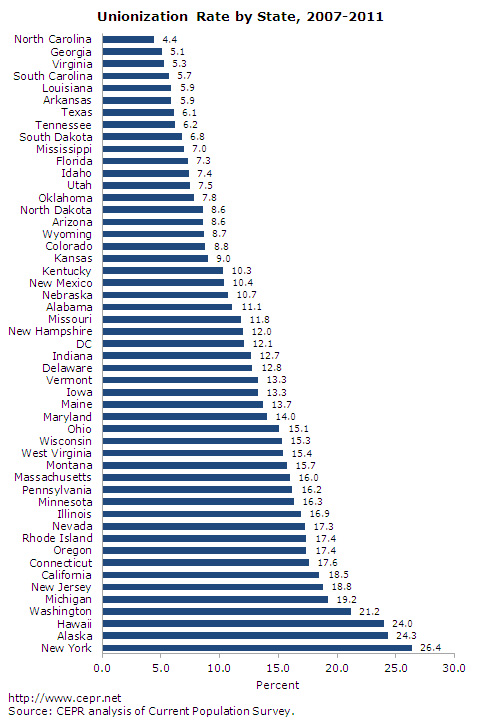
Unionization rates – and the gender and racial composition of unionized workers – vary widely across the 50 states and the District of Columbia. The figures and tables in this issue brief, based on our analysis of the Current Population Survey, give an overview of the size and basic demographics of the unionized workforce in each state. Throughout, we define a unionized worker as anyone who is a member of a union or represented by a collective bargaining agreement.
Graphs (Click for Larger Versions)