Report
Most Children Live in Households that Experience One or More Substantial Declines in Earnings During the Year: The Child Tax Credit Should Be Restructured to Help Them

Report
Legislation currently moving through Congress would expand the Child Tax Credit for one year and direct the Treasury Department to “advance” half of a family’s expected 2021 credit on a monthly basis beginning in July 2021. Current discussion of this and related child allowance plans commonly highlights how they would increase the annual incomes of most low- and middle-income families with children and substantially reduce child poverty as measured using annual income.
Less discussed is how a child allowance could reduce the number of months during the year in which families have no or very low income due to negative shocks to monthly earnings. A growing body of research documents the importance of month-to-month income stability for child and family well-being, so the potential for a well-designed child allowance to buffer negative shocks deserves greater attention.
To help inform the current debate, this brief provides a new look at the prevalence and frequency of substantial declines in monthly household earnings (“negative earnings shocks”) among households with children. We find that most working-class children — children in lower-income households headed by a parent or other adult without a four-year college degree — experience at least one negative earnings shock during a typical year. The likelihood of experiencing such a shock increases as annual household income declines, is higher for children in households headed by adults without a bachelor’s degree, and is somewhat higher for Hispanic and Black children than for white children.
To ensure that a child allowance helps parents meet some of the regular monthly costs of parenting while reducing the risks of overpayments that would have the perverse effect of increasing income instability, Congress should restructure the Child Tax Credit as an “actual” rather than “advanced” payment. This could be done by paying the same per-child benefit to all families with children, as is done in Ireland, Sweden and various other countries.
Alternatively, if the credit remains means-tested, it could be done by having the Treasury Department or the Social Security Administration determine the monthly credit a parent is eligible for starting in July 2021 based on their actual 2020 income (rather than an estimate of their 2021 income that may change), and their child’s current (July 2021) primary residence. This is how Canada structures its child benefit.
As used in this brief, a negative earnings shock is a decline of 20 percent or more in total household earnings from one month to the next. For example, suppose a household consisting of one parent and one child typically works 35 hours a week at $10 an hour. This household’s typical monthly earnings are about $1,516 before payroll taxes. If the parent’s hours are cut, say to an average of 27 hours a week, the household’s earnings will fall by nearly $346 a month, a roughly 23 percent decline and enough to be classified as a negative earning shock.
To document negative earnings shocks within a year, this analysis uses monthly data — covering January 2009 to December 2016 — from the Survey of Income and Program Participation. Including data from all of these years increases the sample size and allows for more reliable estimates of negative earnings shocks experienced by various subcategories of children, including by household income, race and ethnicity, and parents’ education.1 Households are dropped from the sample if they do not include at least one member who worked during the year.2
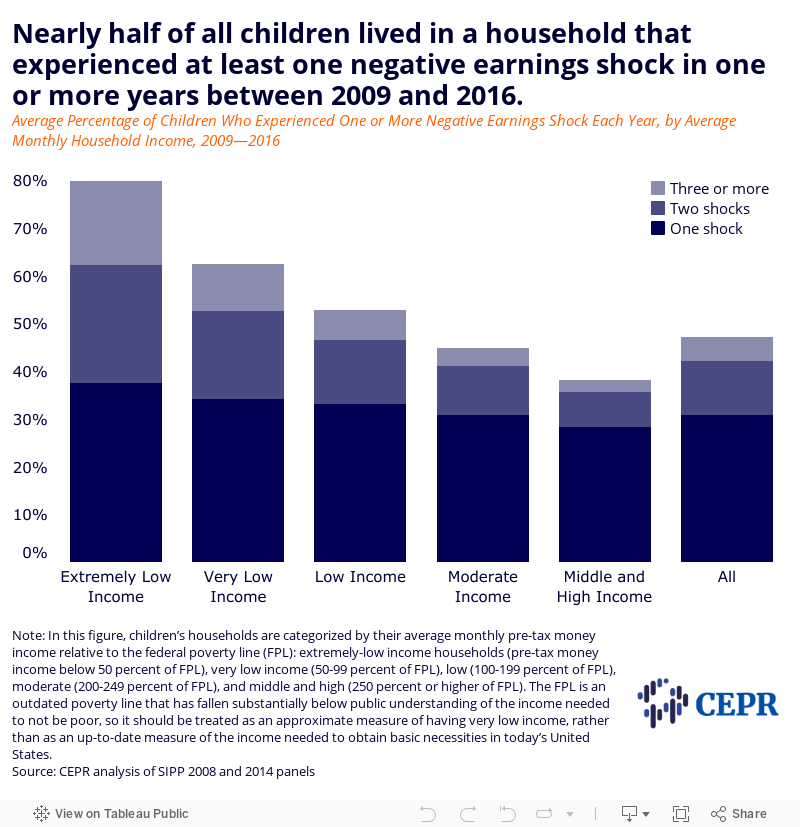
On average, in each of the years from 2009 to 2016, nearly half of all children lived in households that experienced one or more negative earnings shocks. Figure 1 shows how the likelihood of experiencing such a shock increased as household income declined. Among children living in households with extremely low incomes, 80 percent experienced one or more negative earnings shocks on average in each of the years from 2009 to 2016. By contrast, in middle- and higher-income families, about 38 percent experienced such a shock.
Households may experience more than one negative earnings shock in a year. For example, if a household’s earnings fall by over one-fifth between January and February and then fall again by over one-fifth between August and September, they have experienced two negative earnings shocks during the year (regardless of whether their earnings increased in any other months).
About 16 percent of all children experienced two or more negative earnings shocks, on average, annually. As Figure 1 shows, the likelihood of experiencing more than one negative earnings shock increases as monthly household income declines. Less than 10 percent of children in middle- and upper-income households experienced two or more negative earnings shocks on average each year, compared to over 42 percent of children in extremely low-income households.
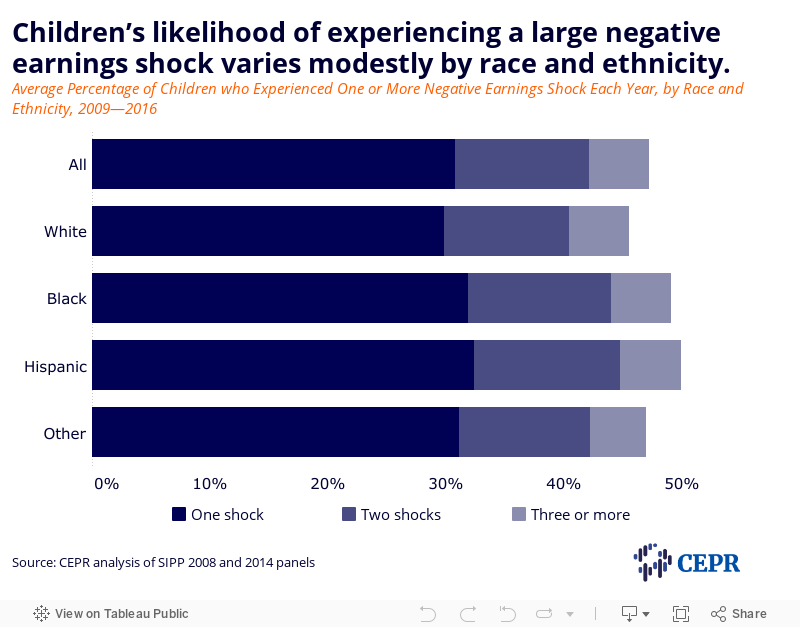
About 45 percent of white, non-Hispanic children experienced one or more negative earnings shocks, compared to about 48 percent of Black children and 50 percent of Hispanic children (see Figure 2). While these differences are not large, Black and Hispanic households are much more likely to have low annual household incomes and little to no savings to draw on than white households. As a consequence, the impact of negative earnings shocks on well-being may be more severe for Black and Hispanic children, on average, than for white children.
Among children living with a parent3 who has a bachelor’s degree or higher, about 41 percent experienced at least one negative earnings shock during the year. By comparison, nearly 50 percent of children living with a parent who has a high school diploma, but no further education, experienced one or more shocks, and more than half of all children living with parents without a high school diploma experienced one or more shocks.
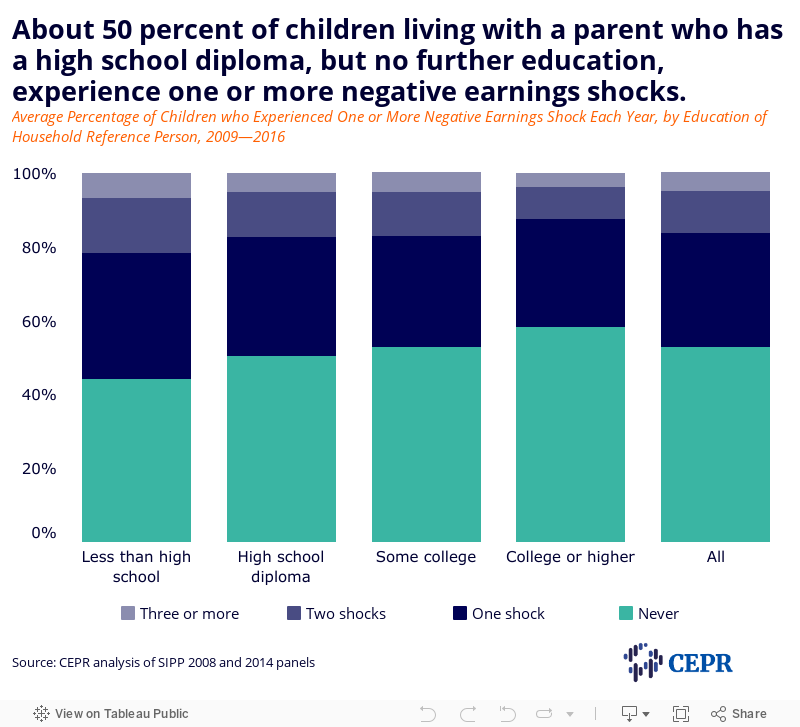
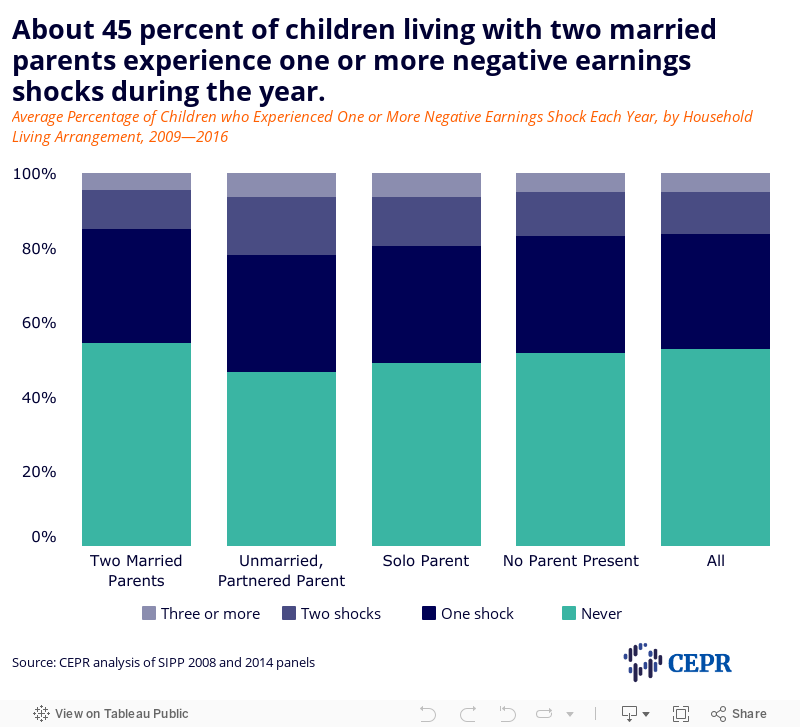
Figure 4 categorizes children by whether they live with two married parents (including adoptive parents and stepparents), a parent with a domestic partner (who may or may not be the child’s biological parent), an unmarried parent without a domestic partner, and/or in a household where no biological, step, or adoptive parent is present.4 Married parents tend to be older, more likely to have bachelor’s degrees, and have higher household incomes than other family types. However, even with these demographic advantages, about 45 percent of children in such families experience at least one negative earnings shock during the year. Unmarried partnered couples with children, who tend to be younger and not have a bachelor’s degree, are more likely than other family types to have experienced a negative earnings shock.
In order to obtain nearly all necessities, households must pay for them on a monthly or more frequent basis. This is one reason why employers typically pay workers on a bi-weekly, weekly, or monthly basis, and public agencies almost always pay social security benefits on a monthly basis.5 The Child Tax Credit and Earned Income Tax Credit are strange exceptions to this general rule of monthly payment. Despite being broad-based benefit programs intended to help parents offset some of the regular, day-to-day costs of raising children, they are paid once a year as a lump sum, typically in the second quarter of the year (March, April, or May), and based on income information for the previous year. This unusual practice also has little precedent in other wealthy countries, which almost always pay similar child benefits on a monthly basis.
As documented in this brief, nearly half of all children live in households that experience at least one negative earnings shock during a typical year. Such shocks are particularly common among lower-income household and households headed by adults without a bachelor’s degree. Congress should expand and restructure the Child Tax Credit as a monthly payment that provides a reliable buffer against these shocks.
Article

Article

Article

Article