Article
In his State of the Union address to Congress President Obama called for a higher minimum wage. The purchasing power of the minimum wage peaked in the late 1960s at $9.22 an hour in 2012 dollars. That is almost two dollars above the current level of $7.25 an hour. Most of the efforts to raise the minimum wage focus on restoring its purchasing power to its late 1960s level, setting a target of around $10 an hour for 2015 or 2016, when inflation will have brought this sum closer to its previous peak in 2012 dollars.
While this increase would lead to a large improvement in living standards for millions of workers who are currently paid at or near the minimum wage, it is worth asking a slightly different question. Suppose the minimum wage had kept in step with productivity growth over the last 44 years. In other words, rather than just keeping purchasing power constant at the 1969 level, suppose that our lowest paid workers shared evenly in the economic growth over the intervening years.
This should not seem like a far-fetched idea. In the years from 1947 to 1969 the minimum wage actually did keep pace with productivity growth. (This is probably also true for the decade from when the federal minimum wage was first established in 1937 to 1947, but we don’t have good data on productivity for this period.)
As the graph below shows, the minimum wage generally was increased in step with productivity over these years. This led to 170 percent increase in the real value of the minimum wage over the years from 1948 to 1968. If this pattern of wage increases for those at the bottom was supposed to stifle growth, the economy didn’t get the message. Growth averaged 4.0 percent annually from 1947 to 1969 and the unemployment rate for the year 1969 averaged less than 4.0 percent.
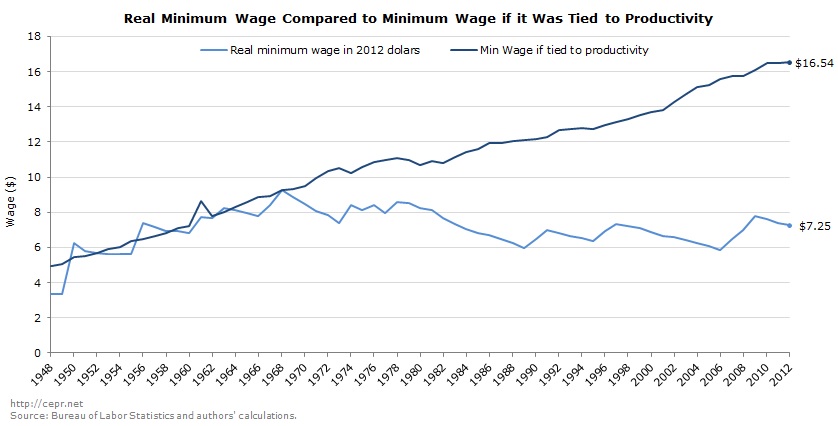
This link between productivity and the minimum wage ended with the 1970s. During that decade the minimum wage roughly kept pace with inflation, meaning that its purchasing power changed little over the course of the decade. The real value of the minimum then fell sharply in the 1980s as we went most of the decade without any increase in the nominal value of the wage, allowing it to be eroded by inflation. Since the early 1990s the real value of the minimum wage has roughly stayed constant, which means that it has further fallen behind productivity growth.
How was it decided to break the link between productivity growth and the minimum wage? It is not as though we had a major national debate and it was decided that low-wage workers did not deserve to share in the benefits of economic growth. This was a major policy shift that was put in place with little, if any, public debate.
If the minimum wage had kept pace with productivity growth it would be $16.54 in 2012 dollars. It is important to note that this is a very conservative measure of productivity growth. Rather than taking the conventional data published by the Bureau of Labor Statistics for the non-farm business sector, it uses the broader measure for economy-wide productivity.[1] This lowers average growth by 0.2-0.3 percentage points.
This measure also includes an adjustment for net rather than gross output. It also uses a CPI deflator rather than a GDP deflator, which further lowers the measure of productivity growth.[2] Even with making these adjustments the $16.54 minimum wage would exceed the hourly wage of more than 40 percent of men and more than 50 percent of women . We would have a very different society if all workers were earning a wage above this productivity linked minimum wage.
[1] If we just used non-farm productivity as the basis for indexing the minimum wage, the most commonly used measure of productivity, the minimum wage would have been $21.75 in 2012 [https://www.cepr.net/index.php/blogs/cepr-blog/new-cepr-issue-brief-shows-minimum-wage-has-room-to-grow].
[2] These adjustments are explained in Baker, 2007. For the years since 2006 we assumed that the difference in the growth rate of non-farm productivity and the growth of this adjusted measure is the same as it was on average for the years 2000-2006.