Article
In 2012, Republican presidential candidate Mitt Romney famously commented that 47 percent of Americans were “dependent on government” because they didn’t pay any federal income taxes. He went on to explain that his job was “not to worry about those people.”
Journalists and other public figures often claim that only the rich pay taxes, supporting this with the argument that the rich pay the vast majority of federal income taxes. However, federal income taxes are just one part of the broader tax code. When we consider other types of federal taxes as well as state and local taxes, it becomes clear that the overall tax code isn’t extremely progressive – in other words, it doesn’t “soak the rich,” and it certainly doesn’t let the poor off the hook.
The aforementioned “47 percent” do pay substantial state and local taxes, but even ignoring these taxes, it’s worth noting that income taxes represent just half of all federal tax revenue:
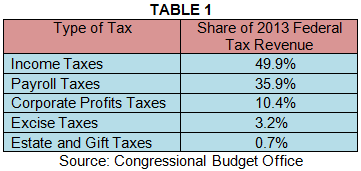
In fiscal year 2013 – the last year for which we have full federal, state, and local data – the federal government raised over $2.6 trillion in total tax revenue. It also raised an additional $134 billion in funds from other sources, most notably customs duties, remittances from the Federal Reserve, and miscellaneous fees and fines. About $1.3 trillion of revenue came from the progressive federal income tax, while another $274 billion came from the progressive corporate profits tax. Estate and gift taxes, which are also progressive, accounted for $19 billion, equivalent to just 0.7 percent of federal tax revenue.
However, various types of regressive taxes – those that hit the poor at higher rates than the rich – were responsible for substantial shares of total revenue. Most notably, over a third of all federal revenue came from payroll taxes. Payroll taxes only apply to wages, meaning that capital income – which goes primarily to the wealthy – completely escapes taxation. The Social Security payroll tax, which is responsible for about three-quarters of all payroll tax revenue, is even more regressive. It is a flat 12.4 percent tax that applies to just the first $127,200 of workers’ wages; this means that a worker making $254,400 per year pays Social Security taxes on just half of his or her wages. (In 2013, the threshold was $113,700.) If that worker makes an additional $254,400 through the stock market, just one-quarter of their total income is subject to the tax. By contrast, a worker making $40,000 a year who doesn’t receive any capital income will have their entire income subjected to the Social Security payroll tax. Finally, the Medicare payroll tax – which isn’t quite as regressive – raises over a fifth of all payroll tax revenue, while various small payroll taxes account for the remaining 5 percent of revenue. As a share of income, payroll taxes are about three times as significant for Americans in the bottom fifth of the income distribution as for those in the top 1 percent. These taxes fund Social Security and Medicare, both of which are very progressive in their benefit structure – but nonetheless, people are being taxed for these benefits.
Finally, about 3.2 percent of federal tax revenue comes from excise taxes. Excise taxes are sales taxes that are levied on specific goods and services. In general, they take more from the poor than from the rich, since the poor have low savings rates and thus spend almost the entirety of their incomes. At the federal level, excise taxes apply to items such as alcohol, tobacco, and gas. The Center on Budget and Policy Priorities estimates that the poorest fifth of households pays 1.6 percent of their income in federal excise taxes every year, while the top fifth pays just 0.4 percent. While excise taxes aren’t a particularly large part of the overall tax code, they are more significant than the estate tax, which conservatives argue places an undue burden on extremely rich families. By contrast, we hear very little about the more significant burdens imposed by federal excise taxes.
So it’s worth keeping in mind the federal income tax is only part of the federal tax structure. It’s true that richer Americans face higher federal income tax rates than lower-income Americans do; and there are other elements of the federal tax code, such as the corporate profits tax and the estate tax, that do this as well. However, federal payroll taxes and federal excise taxes are highly regressive, leading to an overall tax structure that is far less progressive than is often portrayed.
One-Third of Tax Revenues Are Raised at the State and Local Level – And Those Taxes Are Regressive
While the federal tax code is progressive, state and local taxes are quite regressive.
In 2013, state and local governments combined raised over half as much tax revenue as the federal government. The $824 billion paid in state-level taxes and the $606 billion paid in local taxes are a substantial part of the overall tax code:
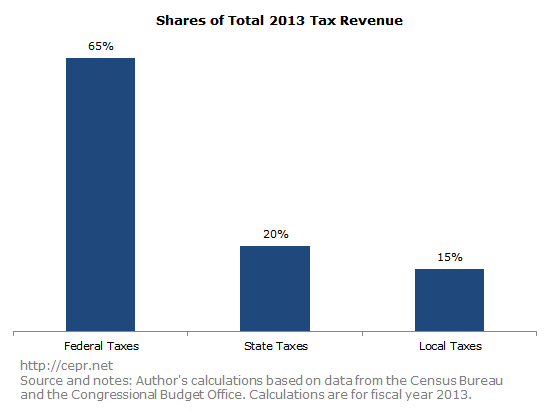
Table 2 below shows the five types of taxes which generate the most revenue at the state and local levels combined. The three most substantial sources of revenue are state and local sales taxes, local property taxes, and state income taxes.
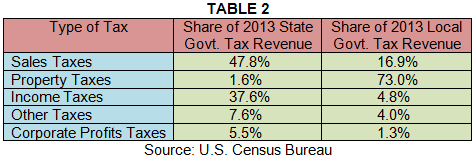
Sales taxes – raised primarily at the state level – are highly regressive for the same reason that federal excise taxes are regressive. Namely, the poor have very low savings rates and end up spending nearly their entire annual incomes, while the rich are able to save their money and thus avoid taxation. According to the Institute on Taxation and Economic Policy (ITEP), families in the bottom fifth of the income distribution pay 7.0 percent of their incomes in state and local sales taxes, while families in the top 1 percent of the income distribution pay just 0.8 percent.
Property taxes are levied primarily at the local level, accounting for 73 percent of local tax revenue. Property taxes are regressive: although the rich own more expensive homes than the poor, house values as a share of income tend to decline at higher incomes. According to the ITEP report, property taxes snag 3.7 percent of the poorest families’ total incomes, 2.8 percent of a middle-class family’s total income, and just 1.6 percent of the richest families’ total income.
The only truly progressive feature of state and local taxes is state income taxes. For this particular type of tax, the poor pay essentially nothing – the average effective state and local income tax rate for the poorest families is just 0.2 percent. However, there is significant variation by state: the rich face significantly higher income tax rates than the poor in California, but in Alabama, the income tax is basically flat.
Finally, there are a host of other taxes imposed by state and local governments, though they don’t raise much revenue. Corporate profit taxes levied by both states and localities tend to be progressive, though state-level property taxes and local-level sales taxes are regressive. Other relatively insignificant taxes have an ambiguous effect on the income distribution.
When you add them all up, state and local taxes are highly regressive. According to ITEP, states and localities tax the bottom 20 percent of income earners at a 10.9 percent rate, the middle 20 percent at a 9.4 percent rate, and the top 1 percent at just a 5.4 percent rate.
Federal Income Taxes are Less than a Third of the Broader Tax Code, Which Is Only Mildly Progressive
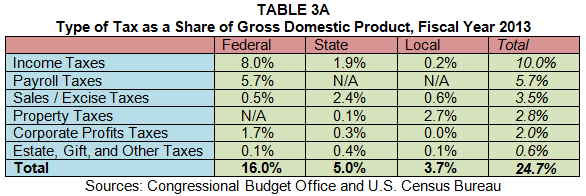
In order to provide a single snapshot of the broader American tax code, Table 3 shows the shares of total tax revenue generated by each specific type of tax. An alternative version of the table at the bottom of this page shows each tax as a share of GDP. The columns in the table distinguish between the type of governments levying the given taxes – federal, state, or local. The rows show the method of taxation – income taxes, payroll taxes, property taxes, etc. The last row shows the total share of revenue raised at each level of government, and the far-right column shows the share of total revenue raised by each method of taxation. For example, federal, state, and local income taxes generated 40.6 percent of all tax revenue in fiscal year 2013; state governments, through all methods of taxation, took in 20.2 percent of all tax revenue; and state sales/excise taxes specifically were 9.7 percent of all tax revenue. In other words, Table 3 provides a comprehensive look at both where and how all tax revenues are generated.
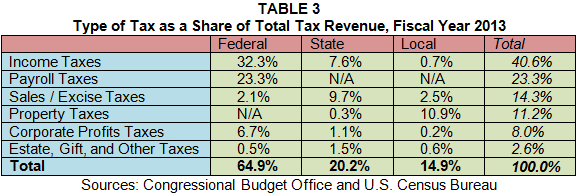
Table 3 shows that the federal income tax generates less than a third of all tax revenue. State and local taxes are actually a larger part of the overall tax code, and unlike the federal income tax, they are overwhelmingly regressive. Federal payroll taxes, which generate three-quarters as much revenue as the federal income tax, are also paid disproportionately by low- and middle-class households.
In fact, the U.S. tax code as a whole is only mildly progressive. In 2016, the top 1 percent of income earners paid 33.7 percent of their incomes in all federal, state, and local taxes. Families in the middle of the income distribution paid nearly the same rate – 27.3 percent. Even those in the bottom fifth of the income distribution had a tax rate of 19.3 percent. Based on Table 3, it’s easy to see why low- and middle-income families pay so much more than is typically reported. Just 49.1 percent of all tax revenue comes from progressive taxes (income and corporate profits taxes at all levels of government along with the federal estate tax). Regressive taxes – sales and excise taxes at all levels of government, federal payroll taxes, and state and local property taxes – account for 48.7 percent of total revenue. The remaining 2.1 percent, consisting of “other taxes” paid at the state and local levels, is ambiguous. If anything, the federal income tax isn’t soaking the rich – rather, it’s keeping the rich from paying a lower tax rate than everyone else.