Report
Housing Insecurity by Race and Place During the Pandemic

Report
The authors thank Karen Conner, Sarah Rawlins, and Matt Sedlar for editorial assistance.
In a previous CEPR publication, we documented the increase in housing insecurity during the early months of the pandemic (late April–July 2020). We found particularly large increases in housing insecurity among Black and Hispanic renters. In this report, we update our analysis with data through December 2020, and provide detail on both housing and food insecurity at the state and metropolitan level.
Our key findings include:
The period covered in this report included the implementation of the CARES Act, signed into law on March 27, 2020, and the first broadly applicable national moratorium on evictions for nonpayment of rent, issued by the Centers for Disease Control on September 4, 2020. These federal measures, along with ones adopted in some states and cities, undoubtedly helped millions of people stay in their homes during the pandemic. Yet, housing insecurity remained very high during this period, and renters and homeowners who were unable to pay their rent or mortgages continued to accrue housing debt.
A subsequent COVID-19 relief bill, signed into law on December 27, 2020, extended the eviction moratorium and provided $25 billion in emergency rental assistance1. The American Rescue Plan Act, signed into law on March 11, 2021, included another $27.4 billion for rental assistance plus additional funding for homeowners, people experiencing homelessness and other housing-related services and assistance2. Further research will be needed to document trends in housing insecurity after these measures are fully implemented.
As Figure 1 displays, on average, nearly one-in-three renters experienced housing insecurity each week from late April 2020 through December 2020. Among homeowners, about one-in-six were housing insecure, a figure roughly the same as in the 2019 Survey of Household Economics and Decision-making (SHED)3. The lack of an increase in housing insecurity among homeowners overall may be surprising but is likely due to differences between renters and homeowners, including in demographic and job-related factors, and differences in the surveys.
As shown in Figure 1, there is a clear widening of housing insecurity by race and ethnicity among both renters and homeowners. In 2020, approximately 43 percent of Hispanic renters and 44 percent of Black renters were housing insecure, up by about 11 percentage points and 7 percentage points, respectively, since 2019. Among Hispanic homeowners, insecurity also increased between 2019 and 2020, but much more modestly.
Figure 1
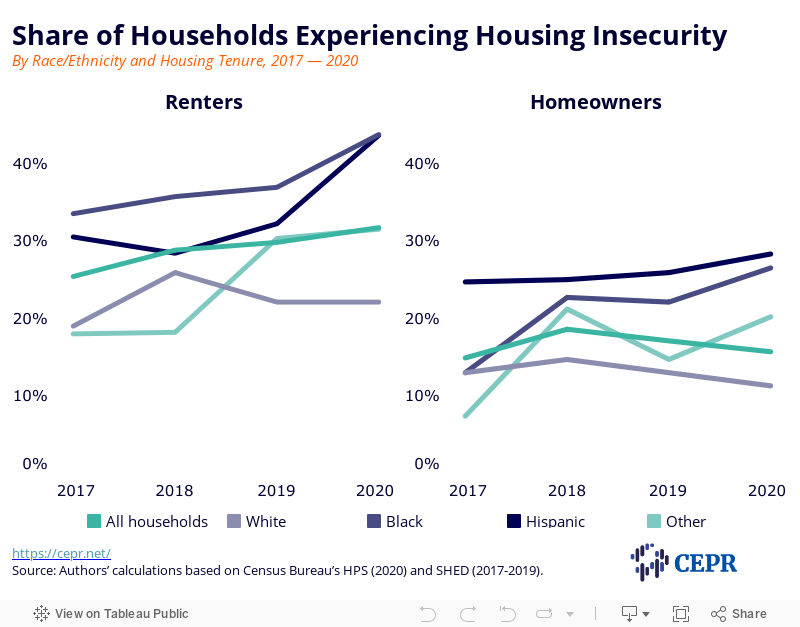
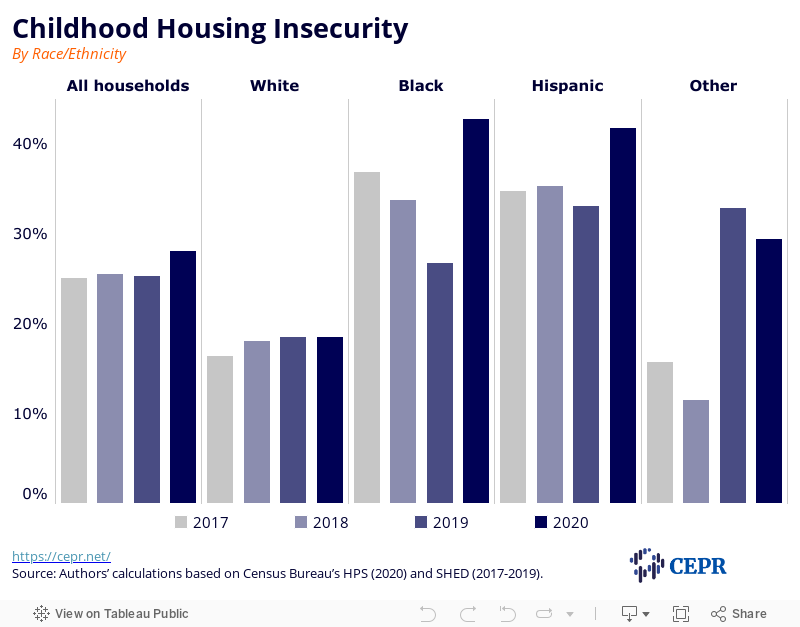
Figure 2 shows housing insecurity among households that include one or more children (in this figure, renters and owners are combined). In the three years before the pandemic, the housing insecurity gaps between white and Black and white and Hispanic households narrowed. But during the past several months this progress was lost, and these gaps are now greater than in prior years with roughly 42 to 43 percent of Hispanic and Black households with children experiencing housing insecurity. Over the past three years, the housing insecurity gap between white and Black and white and Hispanic households with children has ranged from 15 to 20 percentage points; this has increased to 24 percentage points because of recent job losses.
Figure 2
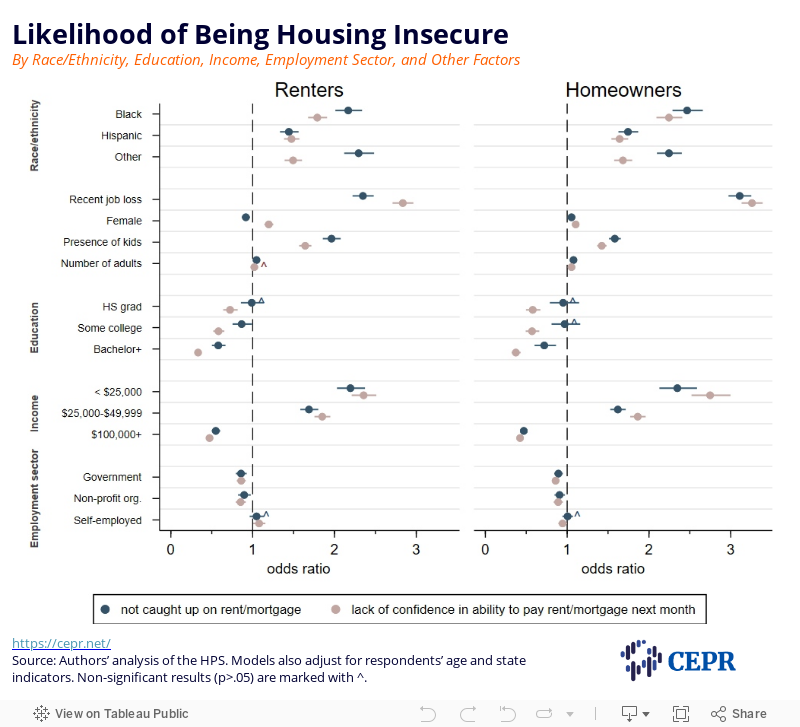
Logistic models are applied to estimate the relationship between a households’ characteristics and two measures of housing insecurity from August 2020 to December 2020: (1) not caught up on rent or mortgage (past insecurity), and (2) having no or only slight confidence in paying next month’s rent or mortgage, including having already deferred, or planning to defer, the upcoming payment (future insecurity). An odds ratio greater than one suggests that the likelihood of the outcome was higher than in the reference group; values less than one indicate a lower likelihood of the outcome compared to the reference group.
As shown in Figure 3, households in which someone has lost a job or employment income since the beginning of the pandemic had considerably higher odds of housing insecurity than those without recent job or earnings losses. Renters who had lost jobs or earnings had 2.7 times higher odds of housing insecurity than their job-stable counterparts.
Similarly, low-income households, non-white people, and households with children generally all had higher odds of housing insecurity compared to their reference groups (respectively, households with incomes of $50,000–$99,999, white households, and households without children).
When asked about their confidence in paying next month’s rent or mortgage, the odds of Hispanic households feeling less confident were about 70 percent higher than those of their white counterparts regardless of housing tenure. The odds for Black renters were even higher, more than twice that of white renters who may struggle with rent payment. Renter households with children had significantly higher odds (75 percent) of falling behind on rent or lacking confidence in upcoming payments, compared with childless households.
Among owner-occupied households, having children increases the odds of housing hardship by about 50 percent. Unsurprisingly, the most financially disadvantaged households, regardless of housing tenure, exhibit exceptionally higher odds of falling behind on housing costs (about two times greater), or lacking confidence about upcoming payments (nearly three times greater), than those with annual incomes between $50,000 and $99,999.
One striking finding shown in Figure 3 is that homeowners have not been immune to the pandemic’s adverse effects on housing security, despite the seemingly stable overall trend shown in Figure 1. Homeowners who have lost employment income between August 2020 and December 2020 (or live with someone who has) are roughly three times as likely to report mortgage payment difficulties as homeowners who have not lost jobs. Similarly, the odds of lacking confidence about mortgage payments or deferring payments are approximately 2.5 times higher for Black homeowners compared to their white counterparts.
Figure 3
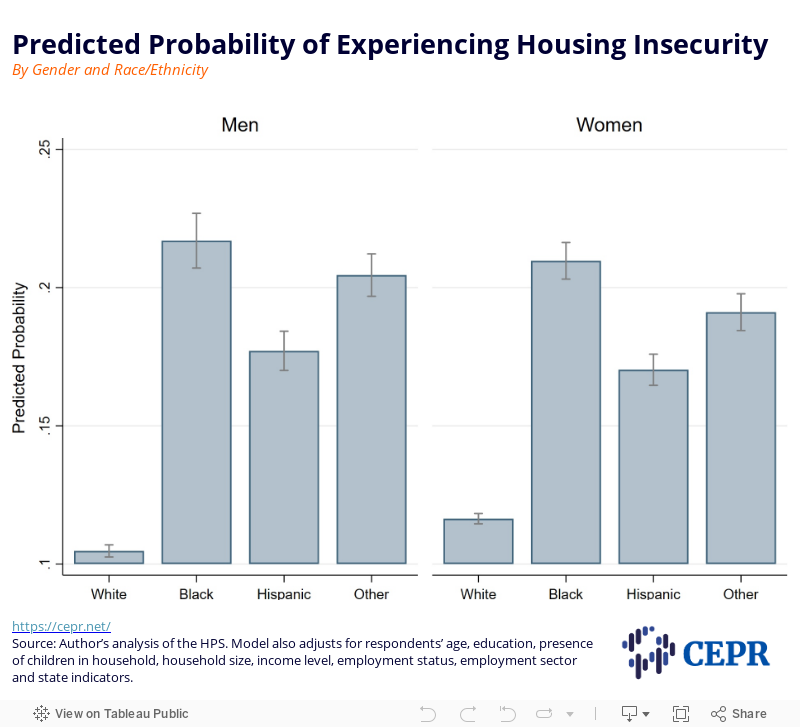
Finally, this report examines whether racial and ethnic differences in housing insecurity (pooling renters and homeowners) vary by respondent’s gender while controlling for various other characteristics, including age, education, presence of children in the household, household size, income category, employment status, employment sector, and state of residence.
As Figure 4 shows, there exist large racial differences in housing hardship. Black men have the highest probability of housing insecurity (0.22), while white men have the lowest, with the difference being about 12 percentage points. Black women are just behind Black men in terms of risk. Next are other racial or ethnic groups (0.20), and then, all with roughly similar risks, are Hispanic men and women.
Figure 4
Between August and December 2022, 17 percent of renter households reported being behind on rent and 10 percent of households with mortgage were behind on their mortgage payments. Among people in renter households behind on rent, nearly half (47 percent) said it was “very likely” or “somewhat likely” that they would have to leave their home because of eviction in the next two months. Among homeowners behind on their mortgages, 20 percent thought it was very or somewhat likely to have to leave their home because of foreclosure.
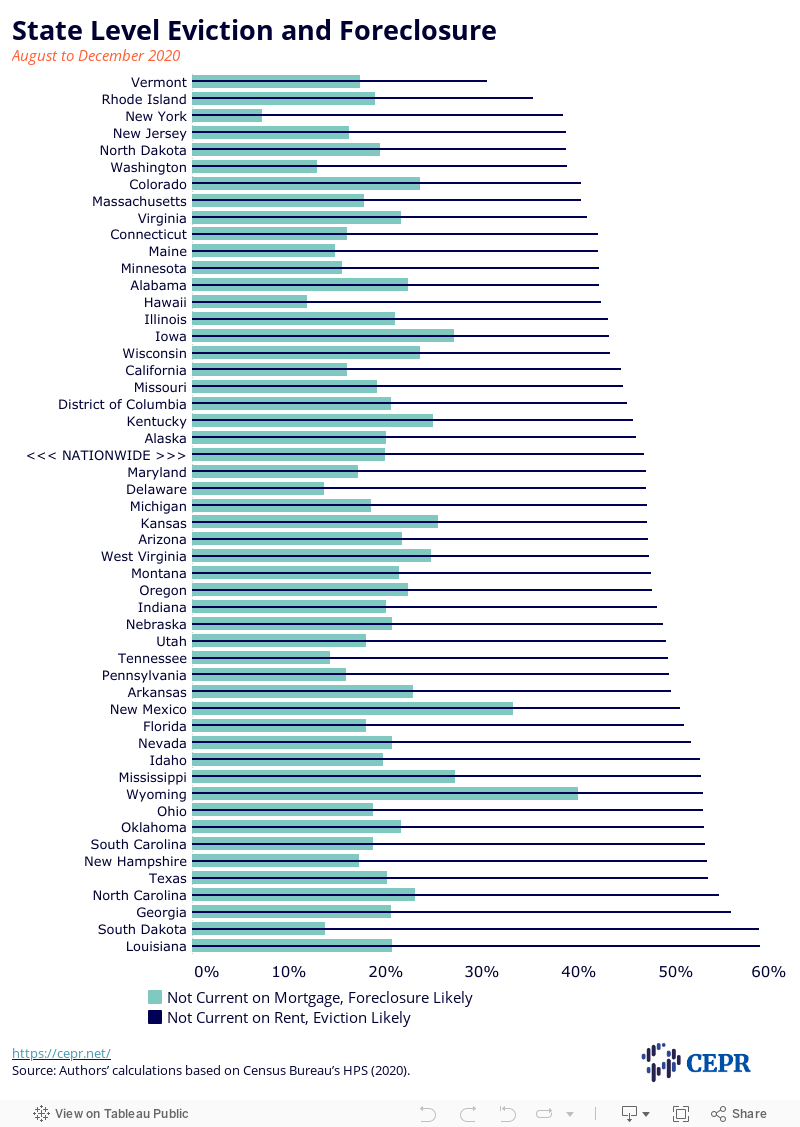
Figure 5 shows the percentage of renters and homeowners (among those who were behind on their rent or mortgage) in each state who thought they were very or somewhat likely to have to leave their home in the next two months. Perceived risk of eviction was generally higher than the national average in the South and lower than the national average in most states in the Northeast and West. Notable exceptions include Ohio and Pennsylvania where the perceived risk was higher than average. Among homeowners behind on their mortgage, there is no clear regional pattern. New York stands out as having relatively high levels of housing insecurity, but relatively low perceived risk of eviction or foreclosure.
Figure 5
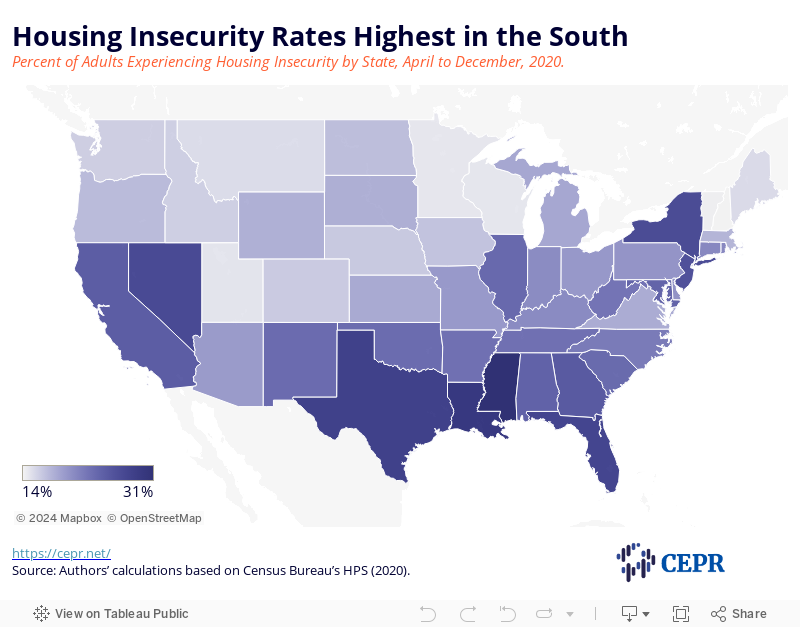
Both housing and food insecurity vary considerably by state. Among adults contributing to rent or mortgage payments, 20 percent nationwide said they had no or slight confidence in making the upcoming payment on time or that the payment would be delayed. As Figure 6 shows, the highest state-level rates of housing insecurity were in the South, especially in Mississippi (31 percent), Louisiana (29 percent), Texas and Florida (both 28 percent). Among non-Southern states, housing insecurity was particularly high in Nevada (26.6 percent), New York (26.3 percent), and New Jersey (25.6 percent). In Georgia and California about one-in-four adults were housing insecure.
Figure 6
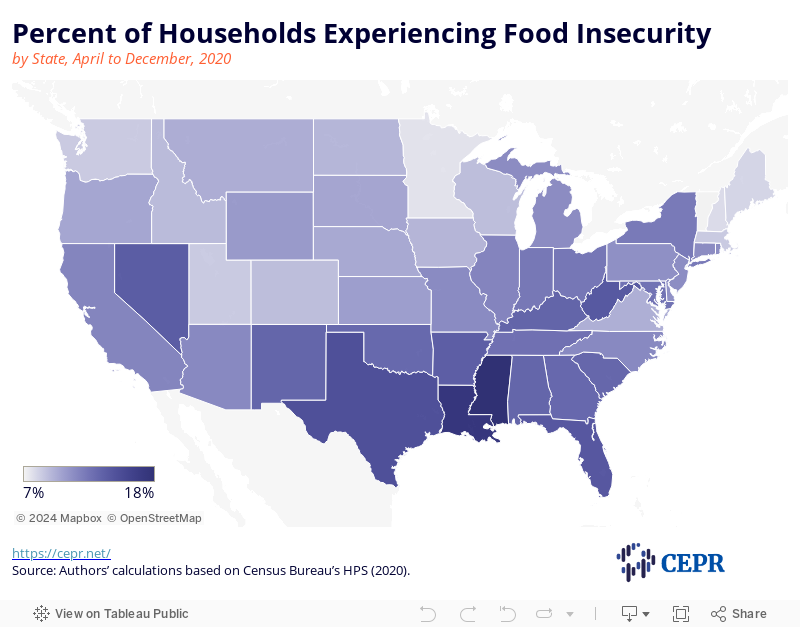
Food insecurity — defined as sometimes or often not having enough food to eat — has been lower than housing insecurity during the pandemic and follows a similar pattern across states (see Figure 7). The percentage of adults experiencing food insecurity was highest in the Southern region (average 14 percent) compared to coastal areas (11 percent) or the Midwest (10 percent). Mississippi, Louisiana, and Texas again had the highest food insecurity rates (18 percent, 17 percent, and 15 percent, respectively). Food insecurity was also relatively high in West Virginia, New Mexico, and Florida.
Figure 7
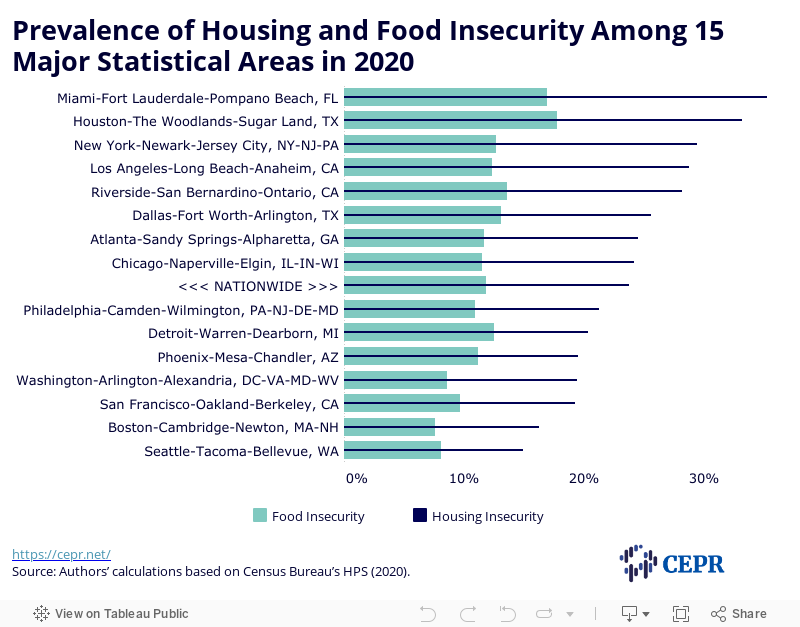
In Figure 8, we summarize the percentage of respondents experiencing housing or food insecurity in the 15 largest metropolitan statistical areas. As with the states, housing insecurity is substantially higher than food insecurity in all the metro areas. Houston and Miami had particularly elevated levels of food and housing insecurity. Housing insecurity was also relatively high in the metro areas of southern California (including Los Angeles and Riverside) and New York metropolitan area, with about 28 percent to 29 percent of residents reporting that they were not confident about next month’s payment. Housing and food insecurity were lowest in Seattle and Boston.
Figure 8
As a result of the pandemic and the associated economic crisis, millions of renters and homeowners fell behind on their housing payments in 2020. Housing insecurity is much higher today, particularly among renters, than before the pandemic. Hispanic renters have seen the largest upward surge in housing insecurity since last year, followed by Black renters. The pandemic has erased the mildly declining patterns of housing insecurity among households with children over the past three years and widened the disparities across racial and ethnic groups seen since 2017.
It is worth noting that due to differences between the SHED and the Census Bureau’s Household Pulse Survey (HPS) surveys, as well as the experimental nature of the HPS, the trends documented in this preview may not fully reflect the exact magnitude of rising housing insecurity during the pandemic. A consistent survey that used the same methods and questions from 2017 through 2020 might show larger changes in housing insecurity between 2019 and 2020, including for white renters and homeowners. However, the overall picture is clear: households that have lost jobs and employment income during the initial months of the pandemic are much more likely to be housing insecure than job-stable households, and racial and ethnic gaps in housing insecurity have widened.
Our analyses that adjust for a range of demographic and other factors further confirm this pattern. Recent household job or earnings losses are significantly associated with housing insecurity. Members of racial or ethnic groups are more likely to be housing insecure. This finding holds for both renters and homeowners. Among owner-occupied households, the odds of skipping last month’s or lacking confidence for next month’s housing payment for Black households is nearly twice that for Hispanics, when compared to their white counterparts. Measures that could prevent foreclosure for homeowners are as important as any rent relief that would help stabilize renters’ financial situations.
Combining data on renter- and owner-occupied households, we find that a typical Black household (irrespective of the respondent’s gender) has a much higher probability of experiencing housing insecurity, even after adjusting for other individual or household characteristics. As a result, the crisis is likely to increase the debt burdens on Black renters and homeowners, increase the number who are evicted or end up in foreclosure, and reduce the ability of Black renters to purchase homes. The combined result is likely to be a widening of the already well-documented racial wealth gap.
Rent and mortgage payments that are deferred or otherwise unpaid become debts that households remain liable for, even during periods covered by federal, state, or local moratoria on evictions and foreclosures. As households that missed or deferred payments gradually work to get back to their financial floor, they will be saddled with large debts. These will be particularly unmanageable for the millions of low-income households that were cost-burdened even in the best of recent times.
The COVID relief packages passed by Congress in December 2020 and March include over $50 billion in new temporary rental assistance as well as additional funding for homeowner assistance, people experiencing homelessness, and other housing-related services and assistance. In the coming months, much will depend on how successfully these provisions are implemented by public officials.
While these immediate relief efforts are essential, it is important to remember that housing insecurity was a major problem before the pandemic. As we have previously documented, just over half of all renters with incomes below $50,000 were housing-cost burdened — spend more than 30 percent of their income on housing — before the pandemic4. Over the last two decades, the percentage of households that rent has risen as has the percentage of renter households who are burdened by housing costs.
Today, most low-income renters and low-income homeowners spend more than half of their income on housing. Large-scale, permanent solutions are needed to address these longstanding problems. These solutions include universal housing assistance, expanding public and social housing, strengthening tenants’ rights, creating community land trusts and land banks in disinvested communities, and combating exclusionary zoning and segregation.
Cai, Julie Yixia, and Shawn Fremstad. “Housing Affordability and Insecurity Before and During the Pandemic.” Center for Economic and Policy Research, September 29, 2020. https://cepr.net/housing-affordability-and-insecurity-before-and-during-the-pandemic
National Low-Income Housing Coalition. “Housing Provisions in Emergency COVID-19 Relief Package”. December 2020, https://nlihc.org/sites/default/files/Housing-Provisions-in-Emergency-COVID-19-Relief-Package.pdf
National Low-Income Housing Coalition. “Housing Provisions in the American Rescue Plan Act”. March 2021, https://nlihc.org/sites/default/files/COVID-Relief-Budget_Reconciliation.pdf
United States Census Bureau. Household Pulse Survey: Measuring Social and Economic Impacts during the COVID‐19 Pandemic. (2020).
The data on housing insecurity for 2020 are from the Census Bureau’s Household Pulse Survey (HPS), a weekly survey which began in April 20205. The first phase of data collection ended in late July, with a one-month break between the first and second wave of data collection. Although the survey questions pertaining to housing from August and onward are slightly different from the earlier wave, one question remained unchanged: How confident are respondents that their household will be able to pay its next housing payment on time? The listed answers for the question are no/slight/moderate/high confidence and payment is/will be deferred. We define households being housing insecure if they reported no or slight confidence or if they anticipated deferring, or had already deferred, next month’s payment. This applies to the 2020 data in Figures 1, 2, 6 and 7, covering April 2020 through December 2020.
Three survey questions in the Census HPS (August 2020 to December 2020) measure housing insecurity: (1) whether the household is currently caught up on rent or mortgage payments; (2) how confident respondents are that their household will be able to pay its next housing payment on time; and (3) for households that are not caught up on rent or mortgage payments, how likely it is that the household will have to leave its current home or apartment within the next two months due to eviction or foreclosure. Figures 3, 4, 5 and 8 are based on data covering August 2020 through December 2020. We categorize answers to the second question as a dichotomous variable and define households as lacking confidence about upcoming payments if they reported no or slight confidence or if they anticipated deferring, or had already deferred, next month’s payment. The listed answers for the third question are: very/somewhat/not very/not likely at all. We define a household as being likely to experience displacement in the following two months if they reported “very or somewhat likely” (see Figure 5). Figure 4 combines renters’ and homeowners’ data and defines housing insecurity as respondents reporting not catching up on home payment or lacking confidence about upcoming payment.
The data on housing insecurity from 2017 to 2019 come from the Federal Reserve’s Survey of Household Economics and Decision-making (SHED). The specific question asked in the SHED is “Are you expecting to be unable to pay or only make a partial payment on each of the following bills this month?” with “rent or mortgage” being one of the listed bills.
The food insecurity measure in Figures 7 and 8 is based on the Census HPS’s surveyed question: Which statements best describe the food eaten in your household in the past 7 days? The answers to this question include: Enough of the kinds of food the household wanted; Enough, but not always the kinds of food the household wanted; Sometimes not enough to eat; Often not enough to eat. We categorize respondents reporting sometimes or often not enough food as being food insecure.
Report

Report


Article