

October 25, 2012
Unless you live in a cave, you’ve no doubt heard about the impending “fiscal cliff” – which is actually much more slope than cliff – and the need for major steps to fix our nation’s financial future. While the fiscal showdown is overhyped, the long-term deficits projections aren’t. So does this mean we’ll need to give Big Bird a pink slip? No. Cutting funding for PBS, Pell Grants, and Acorn doesn’t make a dent in future deficits. Neither do bigger changes, like ending the war in Afghanistan or ending the Bush tax cuts for high earners. The reason for this is that projections of future deficits are driven almost entirely by health care costs.
Next to other industrialized nations, the U.S. healthcare system is wildly inefficient. Despite only average results, the U.S. spends more per person – in many cases twice as much – on health care than any other OECD country. Between Medicare, Medicaid, and a few smaller programs, the government buys about half of all health care, and therefore savings from lower costs would have a dramatic effect on deficits.
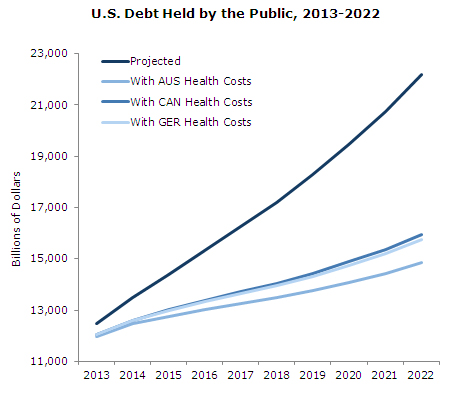
The graph below shows just how dramatic. The graph plots projections for US publicly held debt as a percentage of GDP, and what those projections would look like if the U.S. healthcare system had the same cost per person as Australia, Canada, or Germany. (The baseline projections come from the Congressional Budget Office’s relatively pessimistic alternative fiscal scenario, and projections include interest payments.)

If the US had the health care costs of Australia, we’d see public debt in 2022 fall from a projected 90 percent of GDP to a much more manageable 60 percent. Having the same costs as Canada and Germany would make that number only slightly higher, at around 64 percent of GDP.
The curves for Australia, Canada, and Germany all have the same shape. The reason for this is that the graph is based on taking the current ratio of U.S. health care spending per capita to AUS/CAN/GER health care spending per capita. Will this ratio remain constant over the next decade? Probably not. Per person health care spending in the U.S. has consistently grown faster than in Canada and Germany, and lagged Australia. That trend implies savings would actually be larger than depicted in the cases of Canada and Germany, and less in the case of Australia.
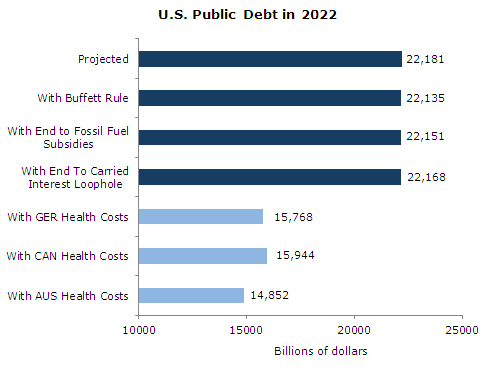
The next graph offers another look at the potential savings from lower healthcare costs, this time not in terms of GDP, but in dollars:
Over the course of the decade, the savings from having the same per-person health care costs as Australia, Canada, and Germany would total $7.3, $6.2, and $6.4 trillion dollars, respectively.
Still, the need to lower health care costs is rarely discussed by our politicians or media. This last chart compares lower health costs with three more widely discussed policies on debt reduction. The graph shows that even if you support these policies, they don’t have nearly the same effect as lowering health costs.
Therefore, while we’ll continue to be bombarded with talk of the need for “shared sacrifice” and a “grand compromise” involving cuts to essential programs like Social Security and Medicare to curb future deficits, the real issue is a broken private sector healthcare system. If costs in the healthcare system are not brought under control, there are no realistic solutions to the deficit problem.

