May 24, 2016
In 2007, the employment rate – the percentage of all Americans 16 and older who have a job – averaged 63.0 percent. The rate fell as low as 58.2 percent during the recession, and has since recovered to just 59.7 percent.
There are significant questions about how much of the drop reflects weakness in the economy as opposed to just an aging population. Between 2007 and 2015, the share of the population aged 25 to 54 – the ages when we expect people to be employed – fell from 54 to 50 percent. Over the same period, the share of the population 55 and older increased 5 percentage points from 30 to 35 percent.
However, it’s also the case that employment has fallen within most age groups. The employment rate of the 25-54 population dropped 5.2 percentage points during the recession and has risen just 3.0 percentage points since then. The employment rate for 55-64 year-olds is close to where it was before the recession, while the employment rate of Americans 65 and older is actually up.
We are not left with an “either-or” proposition. The employment rate has fallen due to cyclical weakness and the aging of the population. So it’s worth asking: how much higher could the employment rate be given the demographic composition of the population?
One way to answer this question is by constructing a “maximum employment rate.” The “maximum employment rate” looks at the current age distribution of the population and asks what the overall employment rate would be if each age group were to achieve its highest calendar-year employment rate. Because rising high school enrollment and graduation rates appear to have decreased employment among 16-19 year-olds, we only measure employment for Americans age 20 and over. Greater detail on the methodology behind the maximum employment rate can be found in the PDF at the bottom of this page.
Figure 1 compares the maximum employment rate to the actual employment from January 1981 to April 2016. The figure reveals at least three noteworthy points. First, the gap between potential and actual employment fell substantially during the 1980s and 1990s due to women’s growing role in the labor market. For example, the entire 6.8-percentage-point increase in the prime-age (25-54) employment rate between 1981 and 2000 was due to rising employment rates for women. Employment for prime-age men was 89.0 percent both years, but it rose from 61.2 to 74.2 percent for prime-age women. Second, the employment gap tends to rise during recessions and fall during expansions, as can be seen in the graph below.
Figure 1
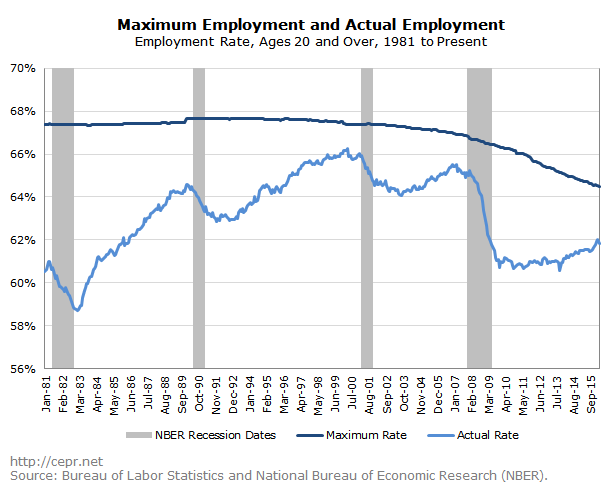
Third, despite the aging of the population, the present gap reveals a significant degree of labor market slack. While April’s 2.7 percentage-point gap is somewhat lower than the gaps from the 80’s and mid-90’s, those gaps had less to do with cyclical weakness in the economy than with low employment rates for women. Ever since the gap between the prime-age employment rates for men and women fell below 15 percentage points for the first time in 1997, the gender employment gap has more or less stabilized. Since then, the gap between actual and maximum employment has typically been less than 2.7 percentage points, as can be seen in Figure 2 below.
Figure 2
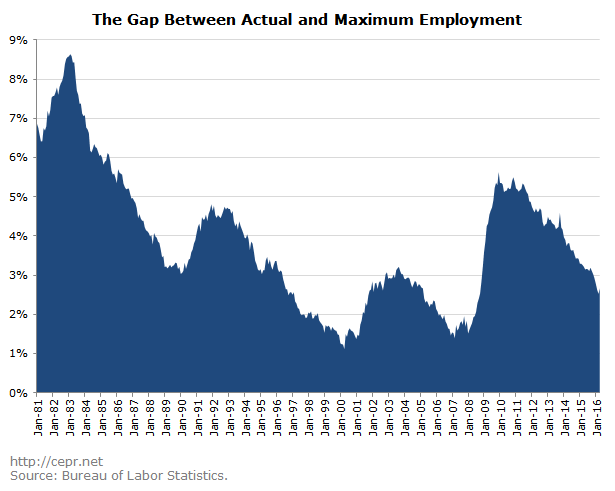
It’s worth asking what sort of gap is sustainable or even achievable – after all, it is unlikely that employment will peak for every age group at the same time. The lowest monthly gap comes from April 2000, when the employment rate was just 1.1 percentage points below its potential rate; the lowest annual difference comes from August 1999 – July 2000, when the gap averaged just 1.4 percentage points. Between 1998 and 2001, the mean gap was 1.7 percentage points; before jumping to 2.1 percent in June 2001, the gap was below 2.0 percent for 33 straight months and was at or below 2.0 percent for 46 of the previous 47 months. In other words, the late 90’s and early 2000’s showed that a low employment gap can be sustained for a long period of time.
As a result of the 2001 recession, the gap peaked at 3.2 percent for a few months in 2003, then fell back to 1.4 percent by March 2007. The two-year low between the 2001 and 2008 recessions was 1.7 percent.
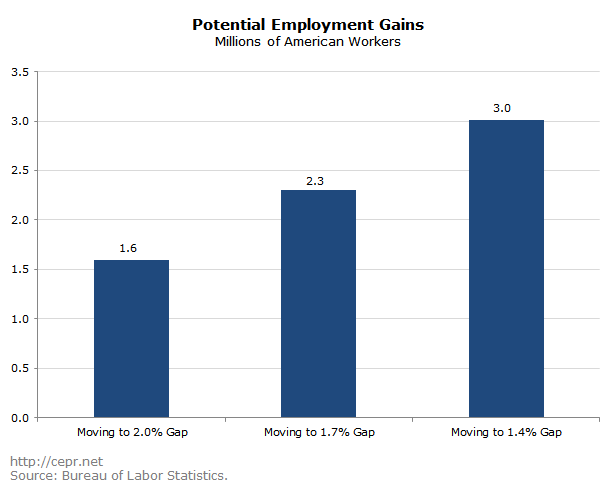
Figure 3 shows how many more Americans would be employed if the employment gap were to fall to 2.0, 1.7, and 1.4 percent, respectively. Clearly there is still significant cyclical weakness (a.k.a. “slack”) in today’s job market. If the labor market were as strong today as it were in the late 90’s or early- and mid-2000’s, millions more Americans would be employed.
Figure 3