


I’m not generally one to get teary-eyed over politicians. They mostly spend their careers trying to appease people with money and power. That’s how you get ahead in American politics. (There are exceptions, most obviously people like Bernie Sanders and Elizabeth Warren.) But they also are the ones who at the end of the day make policy and these policies make a huge difference in the lives of real people, for better or worse.
And once you get to the very top, it is hard to let go. President Biden really deserves our thanks for recognizing that he could best serve the party, the country, and the world by passing the torch.
Biden has much to show for his term in office to date. On the domestic side, he was the most impactful president in more than half a century. First and foremost, he pushed through his big recovery package just after taking office.
Job growth had slowed to a crawl in the last three months of the Trump administration. It would have taken five and half years to get back the lost jobs at the pace the economy was creating them from November of 2020 to January of 2021. Instead, we got the jobs back in a year and half under Biden.
The rapid job growth quickly got us back to full employment, with the unemployment rate reaching 4.0 percent by the end of the year. It fell further in 2022 and remained very low through 2023, although it has crept up modestly in recent months.
We saw the predicted benefits of full employment. The labor market improved most for the most disadvantaged groups in the labor market. Blacks, Black teens, and Hispanics all saw their unemployment rates fall to record lows.
The wage growth was most rapid at the lower end of the wage ladder, reversing the pattern of the last forty-five years. The gap in median wages between white workers and Black workers fell to the lowest level on record.
The strong labor market gave workers unprecedented ability to leave jobs they didn’t like. They could leave boring and dangerous jobs, or ones with few opportunities for advancement, and seek out better ones. As a result, workers reported the highest level of job satisfaction on record.
It’s also important to remind people that Biden really does deserve credit for the recovery package. He pushed it through Congress with only a couple votes to spare in the House and no room in the Senate.
After getting the recovery package through, Biden managed to pass three major bills with long-term impact. First, he passed a bipartisan infrastructure bill, which allocated funding not just for traditional infrastructure, but also replacing lead pipes for drinking water, extended high-speed Internet access, and established a national charging station network for electric vehicles.
He then passed the CHIPS Act which appropriated money for research and provided subsidies for building cutting edge semiconductors in the United States. The case for reshoring manufacturing can be overstated, but it is important to ensure secure supplies of essential economic inputs, and semiconductors certainly fit in that category.
Most importantly, Biden got the Inflation Reduction Act (IRA) passed. This bill was primarily about kick-starting the green transition with subsidies for wind and solar energy, as well as electric vehicles.
While it is easy to say that the bill is inadequate given the size of the problem, the point is that it is a huge foot in the door. Going forward, it will not just be environmentalist-types pushing for money for the transition, it will be major businesses looking for profits. We can be fairly confident that, apart from a complete political catastrophe, we will see considerable pressure for further support for a green transition.
The IRA also included more funding for I.R.S. enforcement. This is a big deal since rich people were increasingly seeing taxes as optional. The I.R.S. now has cops on the beat to crack down on billionaire tax cheats.
Biden also pushed a pro-labor agenda, appointing people to the National Labor Relations Board who take seriously the responsibility to protect workers’ right to organize. He was also the first president ever to join a union picket line when he marched with UAW strikers last fall.
He also appointed people to the Federal Trade Commission and the Justice Department who take anti-trust policy seriously. Mergers and acquisitions that might have gone through unquestioned under prior administrations were scrutinized, and in some cases blocked.
We have seen a half-century of anti-labor policies and neglect of meaningful anti-trust enforcement. This cannot be reversed in a single four-year term, but Biden made a very good start.
I have written much on Biden’s record on domestic policy and will write more, but it was very impactful. He has much to show for three and half years in office with the barest congressional majority in the first two years and a split Congress in the second half of his term. He will be stepping down at the top of his game.
Getting back to Biden’s decision to step down, it is difficult to imagine how hard it is for these people to give up the power and status they have struggled for a lifetime to gain. To take a more pernicious example of a politician whose career in some ways paralleled Biden’s, Richard Nixon rose from a modest background to become vice-president, before narrowly losing the presidential race in 1960 to John F. Kennedy. He then lost a race for governor in California and seemed to declare the end of his political career, saying in an angry press conference “you won’t have Dick Nixon to kick around anymore.”
Remarkably, he came back to get the Republican nomination and then slip into the White House in 1968 in another close election. Being obsessed with power, he spied on his opponents and engaged in various types of illegal activity to contain opposition. (The current SCOTUS would probably say it was all legal.)
Anyhow, things began to unravel for Nixon when the Watergate break-in was uncovered and then people began to talk. The line got traced back to the White House and the key evidence was to be found on Nixon’s own tapes. When the Supreme Court ordered them released and the public saw them, it was clear that Nixon was in on the coverup from the beginning and everything he had said about the case was a lie.
In spite of this, Nixon was prepared to tough it out. The Republicans in Congress realized this was a disaster for the party. They sent a delegation of three senior senators to see Nixon, led by Barry Goldwater, the 1964 nominee and godfather of the modern conservative movement.
They told Nixon the score, trying politely to urge him to step down. Since Nixon’s impeachment in the House was already a foregone conclusion, he began to inquire about whether he could get the one-third of the Senate needed to keep him in office.
According to their account, Nixon turned to them and said something to the effect of “let’s see, I have you three” and then started to come up with other potential names. Goldwater shut this down by telling Nixon that he didn’t know that he could count on him. Nixon resigned the next day.
Anyhow, President Biden obviously cares far more about the country and the party, but the Nixon episode shows how hard can be for people to step aside once they have attained the pinnacle of power. We really do owe him a big debt of gratitude.
I will add one more point to put this in context. Can anyone imagine Donald Trump doing the same thing?
Read More Leer más Join the discussion Participa en la discusión
The Washington Post published a scorecard that evaluated the economy’s performance during the Trump and Biden administrations. While it has much useful information, there are a few areas where it needs some additional clarification.
The first and most important issue is the comparison of real wage growth under Trump and Biden. The problem is that the Post chart uses the average hourly real wage in January 2021, when Trump left office, as the basis for the comparisons.
This is problematic since the wage for that month is hugely distorted by the fact millions of low-paid workers were still unemployed as a result of the pandemic. For example, employment in the low-paying leisure and hospitality sector was 4.1 million lower in January 2021 than it had been in February 2020 before the pandemic hit. This has the effect of raising the average wage in the same way that getting rid of the shortest person in the room increases the average height.
We are interested in the change in real wages that workers actually see, not increases due to changes in the composition of the workforce. There is no perfect way to adjust for this composition issue, but a crude correction would be to treat February 2020 as the endpoint for the Trump years and the start point for the Biden years. This treatment would also be consistent with some of the other graphs, where the pandemic period is pulled out and not attributed to either president.
With this adjustment, the growth in the average real wage for production and nonsupervisory workers during the Trump years was 3.6 percent compared to 3.1 percent in the Biden years. That compares to the growth shown in the Post chart of 7.6 percent in the Trump years and 0.2 percent in the Biden years.
Home Buying
Another area that deserves some comment is its treatment of home buying. The piece compares the monthly cost of buying the median house, relative to median income, under Trump and Biden. This cost was far lower under Trump than Biden primarily because mortgage rates were far lower but also because there was a sharp rise in house prices in the first year of the Biden administration.
While this comparison is accurate, it is primarily relevant for potential first-time homebuyers. That is a relatively small group compared to the 86 million households who already own a home.
This group hugely benefitted by the low interest rates from the start of the pandemic until the Fed began raising rates in March 2022. More than 14 million people refinanced their mortgages at lower interest rates. On average, these households are saving more than $2,000 a year on interest payments.
It is also worth noting that, while the run-up in house prices is an unambiguous negative from the standpoint of first-time buyers, it can be a positive for existing homeowners. Higher house prices will help them if they move to a lower-cost area, downsize, become renters, or opt to get a reverse mortgage to help support their retirement.
Employment to Population Ratios
The piece includes a section showing overall employment to population ratios (EPOP), as well as the ratios for Black and women workers. This sort of comparison is distorted by the fact that the huge baby boom cohort is moving into its 60s and 70s, ages where they are far more likely to be retired.
A better comparison would look at the EPOPs for prime-age workers, ages 25 to 54. By this measure, the Biden administration looks considerably better than the Trump administration. For 2023, the year-round average for the overall prime-age EPOP was 80.7 percent, compared to just 80.0 percent in 2019, the best year under Trump.
For prime-age women workers the year-round average EPOP was 75.1 percent in 2023 compared to 73.7 percent in 2019. For prime-age Black workers the year-round average was 77.6 percent in 2023, 1.6 percentage points higher than the 2019 peak of 76.0 percent under Trump.
There is much useful material in the Post’s charts, but these are areas where some additional context would have been helpful.
Read More Leer más Join the discussion Participa en la discusión
Leading media outlets like The New York Times, The Atlantic, and The New Yorker have about as much concern for intellectual consistency as TikTok videos. In very serious and somber tones they will warn the rest of us about a major problem and then in the next issue, or the next article, present a story that is 180 degrees at odds without ever realizing the contradiction.
My favorite example of this “Which way is up?” problem is the simultaneous concern expressed that AI will eliminate all the jobs and that declining birth rates will lead to worker shortages. We got a taste of the former in an NYT article about efforts by OpenAI’s CEO Sam Altman to promote guaranteed income programs.
According to the piece, Altman and other tech types who share his views, are concerned that AI will lead to mass unemployment and further increase the gap between rich and poor. While this concern is voiced frequently in elite publications it is 180 degrees at odds with almost everything else they write.
First and foremost, if AI is going to lead to massive job loss there is zero reason to worry that declining birth rates will lead to a shrinking workforce. If we don’t have any jobs, why would we need more workers?
This issue also comes up with immigration. We are regularly told that we need immigrants because we have a shortage of native-born workers. But if AI is going to eliminate all the jobs, we won’t need large-scale immigration. To be clear, there are other reasons we might want immigration, but we can’t believe both. AI will lead to a massive loss of jobs and we also need immigrants to do our work.
The idea that AI will lead to massive job loss also means that productivity growth, and therefore economic growth, will be far more rapid than current projections indicate. The latest projections from the Congressional Budget Office show productivity growth averaging a bit over 1.6 percent annually over the next decade.
It’s not clear how fast the AI-will-kill-all-the-jobs gang expect productivity to grow, but we had productivity growth averaging just under 3.0 percent annually from 1947 to 1973, and we still maintained low rates of unemployment through most of this period. Clearly, they must envision considerably faster productivity growth, perhaps 5 or 6 percent annually.
If we had productivity growth anywhere near this fast, many other widely hyped concerns would quickly disappear. For example, the widely touted national debt would look pretty inconsequential if we could sustain anywhere near 5.0 percent productivity growth over a decade. (That would be the case even with 3.0 percent productivity growth.)
Also, the projected shortfalls in Social Security would be eliminated if average wages rose anywhere near as fast as productivity, as has largely been the case in the past. (It’s true that the median wage has not kept pace with productivity growth, but that is mostly due to the upward redistribution of wealth to highly paid workers like CEOs, Wall Street types, and well-placed STEM workers, not a failure of average wages to keep pace with productivity.)
We also would have little reason to be concerned about inflation if we’re seeing the sort of extraordinary productivity gains anticipated by the AI proselytizers. As a first approximation, inflation is equal to wage growth minus productivity growth. If we have productivity growth of 5.0 percent annually, we can have 7.0 percent nominal wage growth and still be at the Fed’s 2.0 percent inflation target. That pace would be more rapid than the peaks we saw in 2021–2022 when we were bouncing back from the pandemic.
In short, if the worldview being hyped by the AI folks in this piece is anywhere close to accurate, many of the concerns expressed in public discussions are completely off the mark. Either the AI gang is wrong or many other people writing in elite publications are wasting their time.
Is There a Case for a Guaranteed Income?
Since people often ask me, I might as well throw in a few words. I find the basic question sort of silly since it rarely is posed in the real-world context of being a question of trade-offs. (This is assuming that the AI gang is wrong in thinking that AI will take all the jobs.) Like many people, I would say that abstractly a guaranteed income would be a good idea, but in a world where millions of parents can’t afford child care, and many have inadequate housing and health care, I would have a hard time arguing that a guaranteed income should be a top priority.
A guaranteed income makes more sense in countries that have more fully developed welfare states. But $1,000 a month, or whatever is picked as the income target, will not pay for people’s health care, food, housing, and their kids’ child care. I would place the priority on ensuring that everyone has access to these necessities.
I’ll also add my other standard line. The massive inequality we see in America today is not simply due to market outcomes, rather it is the result of how we have chosen to structure the market.
The most important issue here is government-granted patent and copyright monopolies. These redistribute over $1 trillion a year from the rest of us to people in a position to benefit from these government-granted monopolies. This is seen most clearly with people like Bill Gates, who might still be working for a living if he couldn’t count on the government arresting people who used Microsoft’s software without his permission. While it is possible to argue for the merits of patent and copyright laws as policies for promoting innovation and creative work, the point is that they are policies, not intrinsic features of the market.
I realize that people who write for elite outlets don’t like to acknowledge the fact that inequality is the result of how we have chosen to structure the market, not the result of the natural workings of the market. This allows them to pontificate about how the winners should best toss a few breadcrumbs to the losers, as the AI gang seems to be doing. It avoids the question of whether we should not have rigged the market in a way to produce such extreme inequality in the first place. (Yes, this is my book, Rigged [it’s free].)
Read More Leer más Join the discussion Participa en la discusión

That is a question that should occur to people who read through the Republican Party’s platform. Not only does the platform promise to extend the 2017 tax cuts, which will potentially put tens of billions of dollars in Elon Musk’s pocket over the next decade, it also promises to “modernize the military.”
“Republicans will ensure our Military is the most modern, lethal and powerful Force in the World. We will invest in cutting- edge research and advanced technologies, including an Iron Dome Missile Defense Shield, support our Troops with higher pay, and get woke Leftwing Democrats fired as soon as possible.”
This looks to be hundreds of billions or even trillions of dollars in additional spending over the next decade. Elon Musk, among others, is likely to be well-situated to get some of the contracts that will be involved in modernizing the military.
It is also important to understand the prospect of a massive increase in military spending in its larger context. We currently are spending roughly $900 billion a year on the military, or a bit more than 3.0 percent of GDP. If we were to expand to the Cold War levels we saw under Reagan, that would take us to $1.8 trillion a year or 6.0 percent of GDP.
In this respect, it is worth noting that the Soviet Union’s economy at its peak was roughly 60 percent of the size of the U.S. economy. China’s economy is already almost 25 percent larger than the U.S. economy and growing considerably more rapidly. This means that if we are getting into a full-fledged arms race, the 1980s Cold War spending may be too conservative.
As far as how much Musk and other military contractors are likely to get out of an increase in spending, it is worth noting that excessive payments and outright fraud are already big problems with military contracting. However, the problem is likely to get considerably worse in a second Trump administration.
There are a number of potential checks on fraud and abuse in place at present. These include the Defense Department’s Inspector General, the Government Accountability Office (GAO), and the Justice Department, which can investigate allegations of fraud.
Donald Trump has said that he wants to remove these sorts of checks on his presidential power. They would all fit into his category of the “deep state.” These people are likely the “woke Leftwing Democrats” who the platform promises to fire as soon as possible.[1]
Trump also has complete authority to direct the Justice Department to ignore allegations of fraud in military contracts. The recent Supreme Court ruling on presidential immunity even stated that a prosecutor could not ask questions as to whether a payment to Trump or his family members, AKA “a bribe”, was a factor in the awarding of a contract. This means there could be quite a windfall in an expanded military budget for well-positioned contractors. (Elon Musk just promised to contribute hundreds of millions of dollars to Trump’s election campaign.)
Matt Yglesias has made a similar point about Trump’s proposal for massive taxes on imports, AKA “tariffs.” Trump would have complete control over the size of these taxes and could increase or decrease them on a whim. This means that if the CEO of a company angered him with a public comment, Trump could hugely increase the taxes imposed on an essential import for this company.
Alternatively, if the CEO were to make a large contribution to Trump’s political action committee or his pocket, Trump could lower the taxes imposed on the company’s imports. And remember, the Supreme Court says no one can ask any questions about Trump’s motives for these actions.
The long and short here is that we always have to worry about corruption in government dealings, however Trump is campaigning on a platform where he is explicitly committed to removing all the potential checks and the Supreme Court has just granted him complete immunity to be as corrupt as he feels like being.
In this context, Elon Musk’s campaign contributions look like to be a very good investment, and very costly for the rest of us.
[1] GAO is a congressional agency, but it is likely that with a Republican trifecta, Congressional leaders would respond to orders from Trump to fire any GAO investigators that were raising questions about contracts he awarded.
Read More Leer más Join the discussion Participa en la discusión
Federal Reserve Board Chair Jerome Powell has been saying for some time that he needs to see more evidence that inflation is under control before he lowers interest rates. We can never be certain of where the economy is going, so it’s understandable that he remains worried that inflation could reaccelerate.
However, there are risks in the opposite direction as well which Powell has explicitly recognized in the past. He has stated that the Fed has an obligation to maximize employment and said that this part of the Fed’s mandate needs to be taken as seriously as its commitment to price stability. That is why many of us were happy President Biden reappointed him as Fed chair. But he has to act now to show this commitment.
June Jobs
The June jobs report released Friday can hardly be viewed as bad. The establishment survey showed the economy creating 206,000 jobs, while the household survey reported the unemployment rate was 4.1 percent (4.05 percent before rounding). Those topline numbers are healthy by almost any standard, but there is cause for concern on both sides.
On the establishment side, the prior two months’ numbers were revised down by a total of 111,000, which means that the June number was only 95,000 larger than the estimate of jobs from the establishment survey that we were looking at in May. This makes the average job gain for the last three months 177,000. That is a reasonable number given current estimates of potential labor force growth, but certainly not a pace that should give the Fed cause for concern about excessive inflationary pressures.
It’s also worth noting that more than a third (70,000) of the job growth in June was in the government sector, almost entirely at the state and local level. Government jobs substantially lagged behind the private sector in this recovery, so this growth is mostly a catch-up story, but it is likely an anomaly. With many state and local governments now facing shortfalls as COVID funds get depleted, they will not be hiring at anywhere near this pace going forward.
Over the last three months, we have created an average of 146,000 private sector jobs. Again, this is a fine pace, but hardly one that should prompt fears of accelerating inflation.
On the household side, we have been seeing a gradual uptick in the unemployment rate since it bottomed out at 3.4 percent last April. If this trend continues, we will be having a serious issue with unemployment. As it is, we should be able to do better than 4.1 percent. The unemployment rate averaged 3.7 percent in 2019, with no clear evidence of inflationary pressures.
As Chair Powell has noted, higher unemployment disproportionately impacts groups that face discrimination in the labor market. We see this clearly with the unemployment rate for Black workers. This bottomed out at 4.8 percent last April (an all-time low). It now stands at 6.3 percent, an increase of 1.5 percentage points.
Getting the unemployment rate down by another half percentage point will make a noticeable difference in the prospects for disadvantaged groups. It should be an important policy goal.
Other data in the household survey also provide some basis for concern. The share of long-term unemployment (more than 26 weeks) has edged up to 22.2 percent of the unemployed. It had been under 19.0 percent at the start of the year. This indicates more people are having serious problems finding jobs.
Another item showing labor force weakness is the relatively small share of unemployment due to voluntary quits. This share stood at 11.2 percent in June, which was up slightly from 10.8 percent in May. This is very low given the overall unemployment rate. It averaged 13.1 percent in the two years before the pandemic. It peaked at 16.0 percent in September 2022. This indicates that workers don’t feel the sort of confidence about their labor market prospects that we would expect given a 4.1 percent unemployment rate.
The June job report also shows that wage growth has slowed to a level that the Fed should feel comfortable with. The annualized rate for the last three months was just 3.6 percent, only a couple of tenths higher than the average for 2018-2019. The year-over-year rate was 3.9 percent.
Other labor market data show a similar trend. The JOLTS data show the job openings rate falling back from a record high at the start of 2022 to roughly the same level as pre-pandemic peaks. The quit rate has fallen to a level slightly below the peaks of 2018-2019. Unemployment insurance claims and continuing claims, after hitting record lows, are now actually slightly higher as a share of the workforce than before the pandemic.
Non governmental data tell the same story. For example, the Indeed Wage Tracker in April showed that wage growth for new hires averaged just 3.1 percent more than a year ago. This is the same as the rate of increase before the pandemic. Since this measure only looks at new hires, it tends to lead movements in the labor market as a whole. This supports the view that wage growth is likely to continue to slow.
It is also important to remember that the profit share of income has increased by almost 2.0 percentage points since the start of the pandemic. Unless the Fed has the view that any rise in the profit share is permanent, it should be prepared to see wage growth somewhat in excess of what might be a sustainable noninflationary long-term rate in order to restore the wage share at least to its pre-pandemic level. It will have to rise considerably further in order for the wage share to revert to its level at the start of the century.
Inflation Is Near the Fed’s Target
Chair Powell has repeatedly said that the 2.0 percent target was an average, not a ceiling. That should mean that an inflation rate close to 2.0 percent is consistent with the target.
Taking the year-over-year numbers we are still considerably higher than 2.0 percent, but this is mostly a story driven by rent. In the case of the Consumer Price Index (CPI), the year-over-year figure is 3.3 percent, but without shelter, it is just 2.1 percent. With the PCE, year-over-year inflation is 2.6 percent, but without shelter it is less than 1.9 percent.
It is reasonable to pull out shelter since this is driven by leases that were signed 1–2 years ago. The inflation rate for rent on housing units that go on the market is very low and possibly less than zero. The inflation rate for shelter will converge on the rate for new units even if the timing of this convergence is uncertain. But the point is that the Fed can be confident that the direction of inflation in the near-term is lower, going towards the Fed’s target.
We also know that expectations of inflation by many measures are back or nearly back to their pre-pandemic levels. The Atlanta Fed’s measure of business expectations of year-ahead inflation is 2.3 percent, a rate that we saw at several points in 2018–2019. The other regional Feds’ indexes for manufacturers’ expectations of prices paid and prices received also show a return to pre-pandemic rates.
The breakeven inflation rate for five-year inflation-indexed bonds is now just over 2.2 percent, virtually the same as the rate at several points in 2018. Also, it is important to remember that the index used for these bonds is the CPI, which typically has an inflation rate that is 0.2–0.3 percentage points higher than the PCE that the Fed targets. This means that expectations in the bond market are that inflation will be at or perhaps slightly below the rate targeted by the Fed.
The story here is that the risk of an inflationary spiral like what we saw in the 1970s is now near zero. Wage growth has moderated to a pace that is almost the same as what we saw before the pandemic and is likely to slow further. In addition, inflation has been gradually slowing for the last two years and is virtually certain to continue to slow.
The Fed’s Rate Cut Trade-Offs
Much reporting has framed the rate cut decision as one where the Fed has to be worried about being embarrassed by lowering rates too soon and seeing a reacceleration of inflation. The argument is that the Fed erred by waiting too long before raising rates in 2022, which allowed inflation to get higher than if the Fed had been more vigilant. Since the Fed had made this mistake, it doesn’t want to again err on the side of excessive inflation by cutting rates too soon, which would be a major embarrassment.
While that may be the framing of some observers, there is little logic to the argument. The Fed has its dual responsibilities of maintaining low inflation and maximizing employment. If it now errs by needlessly allowing the unemployment rate to continue to rise, it does not somehow even the score. This mistake is not made any better by the fact that it made a mistake in the opposite direction three years ago. The Fed has to try to make the right call now, based on the data it has.
On that front, it seems difficult to maintain that excessive inflation is a greater threat than a weakening labor market. The unemployment rate has risen 0.7 percentage points in the last 14 months. It is now 0.3 percentage points higher than the average we saw in the last two years before the pandemic. That corresponds to another 510,000 people being unemployed who would be employed if we had a stronger labor market. If current trends continue, this figure will rise further over the next year. This should be taken seriously.
There is also the point that high interest rates have put a serious dent in the housing market. Sales of existing homes are down by more than 30 percent from their peaks in 2021 before the Fed started raising rates. As a result, hundreds of thousands of potential first-time buyers are being kept out of the housing market. Millions of homeowners who might otherwise sell their homes are keeping them off the market and being prevented from making moves they want to make.
While rates will not decline to the point where we again see the 3.0 percent mortgages of 2021, it is reasonable to believe that lower rates from the Fed can get the mortgage rate back under 6.0 percent and eventually close to 5.0 percent. That would make a huge difference in the housing market.
High rates are also increasing financial instability. It is unlikely that we will see more failures like the collapse of Silicon Valley Bank in 2023, but banks will be hit in the months and years ahead by the write-down of loans on commercial real estate. Lower rates will make it far easier for them to get through a rash of defaults and bankruptcies in this sector. The housing market and financial stability may not rank as high as maximizing employment and low inflation on the Fed’s priority list, but they are factors it should take into account in setting interest rates.
There are events in the world that could see a reigniting of inflation. The Houthi attacks on shipping in the Red Sea have sent shipping costs soaring, which will be passed on in higher prices. A larger war in the Middle East could take oil offline and send gas prices soaring again. Many other possible disasters could be added to this list.
But these sorts of events are always a risk. The Fed can’t design monetary policy with the idea that it should try to limit inflation in the event some crisis occurs. It needs to respond to the economy that it is seeing at the time. And right now, this economy is arguing for lower rates.
Addendum – June CPI Decline Cements the Case
The CPI fell 0.1 percent in June, the first drop since the shutdown days at the start of the pandemic. The decline was to some extent an anomaly since a sharp drop in energy prices took the overall index into negative territory but inflation in the core index was just 0.1 percent.
The good part of the story is that just about everything in this report seems to be going in the right direction. Slower rental inflation, which we have been predicting based on the rents in marketed units that change hands, is now showing up in the CPI. The rental indexes both rose just 0.3 percent in June.
Inflation in medical services rose just 0.2 percent. New vehicle prices fell by 0.2 percent, used vehicle prices fell 1.5 percent. The index for household furnishings and supplies fell by 0.2 percent. Even the index for veterinarian services, which had been rising rapidly, fell by 0.5 percent in June.
More important than the topline number here is the fact that there is now basically zero evidence of ongoing inflation at an excessive rate. The index excluding shelter has risen just 1.8 percent over the last year. It is definitely time for the Fed to cut rates.
Read More Leer más Join the discussion Participa en la discusión
Low-wage workers have seen large real wage gains since the pandemic, so naturally as we come to the July 4th holiday the New York Times gives us a piece telling us how they are hurting. The piece is headlined, “America’s divided summer economy is coming to an airport or hotel near you.” If there is any ambiguity here the subhead tells us, “The gulf between higher- and low-income consumers has been widening for years, but it is expected to show up clearly in this travel season.”
It’s striking that we see a widening gulf with real wages rising far more rapidly at the bottom than the top. Real wages for workers in the bottom decile have risen 12.1 percent in the last four years. For workers in the second quintile, they have risen by 5.0 percent.
These increases come after four decades where they were close to stagnant and in spite of the enormous disruptions created by the pandemic. Given this reality, it is striking that the NYT felt the need to tell us that lower paid workers are now suffering this July 4th.
To tell this story, they found an extremely atypical worker.
“Recent economic trends could exacerbate that. Lashonda Barber, an airport worker in Charlotte, N.C., is among those feeling the pinch. She will spend her summer on planes, but she won’t be leaving the airport for vacation.
“Ms. Barber, 42, makes $19 per hour, 40 hours per week, driving a trash truck that cleans up after international flights. It is a difficult position: The tarmac is sweltering in the Southern summer sun; the rubbish bags are heavy. And while it’s poised to be a busy summer, Ms. Barber’s job is increasingly failing to pay the bills. Both prices and her home taxes are up notably, but she is making just $1 an hour more than she was when she started the gig five years ago.”
For a typical worker at Ms. Barber’s point in the income distribution nominal wages (before adjusting for inflation) rose 30.4 percent over the last five years. This means that if she were representative of a worker at her point in the wage distribution she would have seen a pay hike of around $5.40 an hour rather than the $1.00 increase reported in the article.
The piece itself acknowledges this point:
“While that is not the standard experience — overall, wages for lower-income people have grown faster than inflation since at least late 2022 — it is a reminder that behind the averages, some people are falling behind.”
It is hard to understand why the paper would deliberately choose to make such an atypical worker the focus of its article. It might have been helpful if it had chosen to tell us how a worker who received something close to the average pay increase is faring on this holiday.
Read More Leer más Join the discussion Participa en la discusión
One of the standard refrains from people pushing the bad economy story, despite the extraordinary streak of low unemployment, is that because of inflation everyone has to work two jobs. This ignores the fact that wages have actually outpaced prices, especially for workers at the lower end of the wage ladder.
But there has in fact been some rise in the number of multiple jobholders as can be seen in the graph below.

There are two obvious points in this graph. First, the current level is not especially high. We are roughly back to the share we saw before the pandemic and well below levels of multiple jobholders in the 1990s.
The second point is that multiple job holding looks to be to some extent a cyclical variable. It increases when the economy is good and more jobs are available. This suggests that many people are not working multiple jobs because they have to, but rather because the good economy gives them the opportunity. When the economy was weaker and jobs were harder to find, they were not able to get a second job.
There is another dimension to this issue that is not widely appreciated. Our research assistant, Alex Richwine, looked at the share of multiple jobholders who report that they do telework. His analysis found that 36 percent of multiple jobholders report that they do telework. (This is from the January to March Current Population Survey.)
Teleworkers accounted for 23 percent of all workers over this period. While the share of multiple jobholders overall is roughly 5.2 percent, for the 77 percent of workers who do not report being teleworkers it is just 4.3 percent, a lower figure than at any point prior to the pandemic.
This indicates that multiple job holding today is to a substantial extent a result of the increased opportunities created by teleworking. While people did do telework prior to the pandemic, opportunities for telework exploded as a result of the pandemic.
One outcome of this explosion in telework is that more people are able to take a second or third job, if they want one. That sounds like a good thing to me.
One of the standard refrains from people pushing the bad economy story, despite the extraordinary streak of low unemployment, is that because of inflation everyone has to work two jobs. This ignores the fact that wages have actually outpaced prices, especially for workers at the lower end of the wage ladder.
But there has in fact been some rise in the number of multiple jobholders as can be seen in the graph below.
There are two obvious points in this graph. First, the current level is not especially high. We are roughly back to the share we saw before the pandemic and well below levels of multiple jobholders in the 1990s.
The second point is that multiple job holding looks to be to some extent a cyclical variable. It increases when the economy is good and more jobs are available. This suggests that many people are not working multiple jobs because they have to, but rather because the good economy gives them the opportunity. When the economy was weaker and jobs were harder to find, they were not able to get a second job.
There is another dimension to this issue that is not widely appreciated. Our research assistant, Alex Richwine, looked at the share of multiple jobholders who report that they do telework. His analysis found that 36 percent of multiple jobholders report that they do telework. (This is from the January to March Current Population Survey.)
Teleworkers accounted for 23 percent of all workers over this period. While the share of multiple jobholders overall is roughly 5.2 percent, for the 77 percent of workers who do not report being teleworkers it is just 4.3 percent, a lower figure than at any point prior to the pandemic.
This indicates that multiple job holding today is to a substantial extent a result of the increased opportunities created by teleworking. While people did do telework prior to the pandemic, opportunities for telework exploded as a result of the pandemic.
One outcome of this explosion in telework is that more people are able to take a second or third job, if they want one. That sounds like a good thing to me.
Read More Leer más Join the discussion Participa en la discusión
The New York Times had an article on the prospects for investment in clean energy if Donald Trump gets back in the White House. At one point the piece quotes Senator John Barrasso, a Republican from Wyoming, on the tax credits for electric vehicles:
“The electric vehicle tax credit benefits the wealthiest of Americans and costs hardworking American taxpayers billions of dollars, …”
It would have been useful to point out that individuals with an income above $150,000 and couples with income above $300,000 are not eligible for the tax credits. In other words, the senator’s charge that the tax credits benefit the wealthy is not true. New York Times readers should know this.
Read More Leer más Join the discussion Participa en la discusión
As a major proponent of global warming, Donald Trump apparently thinks it benefits him to be perceived as a savior of jobs in the coal industry. This is likely not because he can do much to protect the country’s remaining coal jobs, but it gives him an opportunity to appear to be supporting workers.
The Washington Post, which is owned and controlled by people who will pay lower taxes with Donald Trump back in the White House, seems anxious to help Trump in this effort. That is the most likely explanation for the article near the top of the home page on how the Democrats are facing problems in a coal county in Pennsylvania.
Before dealing with the specifics of the article, some background on coal and coal mining jobs is needed. The coal industry used to be a huge employer, both in Pennsylvania and across the country, as shown below.
Coal Industry Employment Since 1890
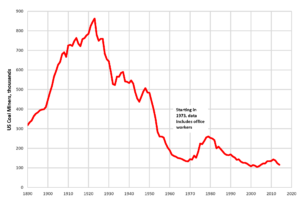
Source: US Census via Wikimedia.
At its peak in the middle of the 1920s, there were more than 850,000 people employed in coal mining. This was a time when total non farm employment was around 30 million, which means that coal mining would have accounted for roughly 2.8 percent of all jobs in the country.
Employment in the industry fell sharply over the next four decades, as oil and gas heating replaced coal to a large extent, and productivity growth reduced the need for miners. By the late 1960s, we were down to around 130,000 jobs in the coal industry, meaning we had lost over 700,000 jobs. At that point, total non farm employment was over 70 million, so the coal industry accounted for a bit less than 0.2 percent of total employment.
There was an uptick in employment in the industry in the 1970s, as the OPEC price increases led people to switch back to coal. Employment in the industry peaked at roughly 260,000 in 1979.
Employment in the industry then fell sharply over the next 20 years, sitting at just over 100,000 by 2000. The major factor was productivity growth, as strip mining replaced underground mining and also a switch back to oil and gas as their price fell back from the 1970s levels. Pollution regulation was also a factor in this decline, but a less important one. We were producing 50 percent more coal in 2000 than we had in 1979.
In the last dozen years, employment in the industry again fell sharply as natural gas displaced coal in many electric power plants. Currently, employment stands at a bit over 40,000, which is slightly less than 0.03 percent of total employment.
It’s clear that the general direction of employment in the coal industry is downward. Solar and wind power are already cheaper in most circumstances, with the costs declining rapidly. The cost of battery storage is also declining rapidly. Unless we impose massive taxes on clean energy and/or have huge subsidies for coal, we will be using much less coal in the years ahead.
This means that we will lose most or all of these 40,000 jobs in the not distant future. The question is, how big a deal is this?
Let’s say we lose the jobs over the course of a decade. That comes to 4,000 jobs a year. By comparison, in a healthy economy, 1,600,000 workers are laid off or fired from their jobs every month. This means that the 4,000 or so coal mining jobs we can expect to lose over the course of a year are less than one-tenth the number of people who would be losing their jobs in a typical day.
To be clear, the fact that lots of other people are losing their jobs doesn’t mean the job loss is any less traumatic for these coal miners. In many cases, this will be the best job they can ever hope to get. And in some small towns, the coal mine will be the main employer, so its loss will devastate the community. That is not something to be trivialized.
But we do need to keep it in perspective. Between 2000 and 2007 (before the Great Recession) we lost 3.5 million manufacturing jobs, largely due to trade. This far more massive loss of jobs (roughly 100 times as many) seemed to get less attention from the WaPo and other media outlets than the coal mining jobs now at risk.
Even taking this WaPo piece at face value, it’s difficult to see much of a case for its story. Pennsylvania is widely recognized as a swing state and a small number of votes can make a difference, but we should be clear on how small the number at stake here is likely to be.
Pennsylvania has 4,700 coal mining jobs as of May. Total employment in the state was 6.15 million, which means that the industry accounted for less than 0.08 percent of statewide employment.
The counties where coal is important are overwhelmingly white. Indiana County, which is the focus of the article is roughly 95 percent non-Hispanic white. Trump carried the rural white vote in 2020 by margins of close to two to one even in areas like rural Minnesota and Wisconsin, where the coal industry has never been an issue. That means that if Biden can somehow overcome anger over coal jobs, he would still likely lose these voters by a large margin.
Suppose that every coal mining job is associated with two votes and if Biden can somehow do the right thing by the miners (in their view) it will reduce Biden’s losing margin among this group by 10 percentage points. That would translate into 940 additional votes for Biden. This is almost certainly a large exaggeration of what is plausibly at stake since many of these people will not vote and 10 percentage points would be a very large shift.
In 2020, Biden’s margin of victory in the state was 1.2 percentage points or 80,000 votes. In this context, the 940 votes plausibly at issue in coal country could matter, but it’s not likely.
What could have a much greater effect is if the Washington Post and other major media outlets can keep up a drumbeat that Biden is indifferent to the plight of ordinary workers. That is how this article is best understood.
As a major proponent of global warming, Donald Trump apparently thinks it benefits him to be perceived as a savior of jobs in the coal industry. This is likely not because he can do much to protect the country’s remaining coal jobs, but it gives him an opportunity to appear to be supporting workers.
The Washington Post, which is owned and controlled by people who will pay lower taxes with Donald Trump back in the White House, seems anxious to help Trump in this effort. That is the most likely explanation for the article near the top of the home page on how the Democrats are facing problems in a coal county in Pennsylvania.
Before dealing with the specifics of the article, some background on coal and coal mining jobs is needed. The coal industry used to be a huge employer, both in Pennsylvania and across the country, as shown below.
Coal Industry Employment Since 1890
Source: US Census via Wikimedia.
At its peak in the middle of the 1920s, there were more than 850,000 people employed in coal mining. This was a time when total non farm employment was around 30 million, which means that coal mining would have accounted for roughly 2.8 percent of all jobs in the country.
Employment in the industry fell sharply over the next four decades, as oil and gas heating replaced coal to a large extent, and productivity growth reduced the need for miners. By the late 1960s, we were down to around 130,000 jobs in the coal industry, meaning we had lost over 700,000 jobs. At that point, total non farm employment was over 70 million, so the coal industry accounted for a bit less than 0.2 percent of total employment.
There was an uptick in employment in the industry in the 1970s, as the OPEC price increases led people to switch back to coal. Employment in the industry peaked at roughly 260,000 in 1979.
Employment in the industry then fell sharply over the next 20 years, sitting at just over 100,000 by 2000. The major factor was productivity growth, as strip mining replaced underground mining and also a switch back to oil and gas as their price fell back from the 1970s levels. Pollution regulation was also a factor in this decline, but a less important one. We were producing 50 percent more coal in 2000 than we had in 1979.
In the last dozen years, employment in the industry again fell sharply as natural gas displaced coal in many electric power plants. Currently, employment stands at a bit over 40,000, which is slightly less than 0.03 percent of total employment.
It’s clear that the general direction of employment in the coal industry is downward. Solar and wind power are already cheaper in most circumstances, with the costs declining rapidly. The cost of battery storage is also declining rapidly. Unless we impose massive taxes on clean energy and/or have huge subsidies for coal, we will be using much less coal in the years ahead.
This means that we will lose most or all of these 40,000 jobs in the not distant future. The question is, how big a deal is this?
Let’s say we lose the jobs over the course of a decade. That comes to 4,000 jobs a year. By comparison, in a healthy economy, 1,600,000 workers are laid off or fired from their jobs every month. This means that the 4,000 or so coal mining jobs we can expect to lose over the course of a year are less than one-tenth the number of people who would be losing their jobs in a typical day.
To be clear, the fact that lots of other people are losing their jobs doesn’t mean the job loss is any less traumatic for these coal miners. In many cases, this will be the best job they can ever hope to get. And in some small towns, the coal mine will be the main employer, so its loss will devastate the community. That is not something to be trivialized.
But we do need to keep it in perspective. Between 2000 and 2007 (before the Great Recession) we lost 3.5 million manufacturing jobs, largely due to trade. This far more massive loss of jobs (roughly 100 times as many) seemed to get less attention from the WaPo and other media outlets than the coal mining jobs now at risk.
Even taking this WaPo piece at face value, it’s difficult to see much of a case for its story. Pennsylvania is widely recognized as a swing state and a small number of votes can make a difference, but we should be clear on how small the number at stake here is likely to be.
Pennsylvania has 4,700 coal mining jobs as of May. Total employment in the state was 6.15 million, which means that the industry accounted for less than 0.08 percent of statewide employment.
The counties where coal is important are overwhelmingly white. Indiana County, which is the focus of the article is roughly 95 percent non-Hispanic white. Trump carried the rural white vote in 2020 by margins of close to two to one even in areas like rural Minnesota and Wisconsin, where the coal industry has never been an issue. That means that if Biden can somehow overcome anger over coal jobs, he would still likely lose these voters by a large margin.
Suppose that every coal mining job is associated with two votes and if Biden can somehow do the right thing by the miners (in their view) it will reduce Biden’s losing margin among this group by 10 percentage points. That would translate into 940 additional votes for Biden. This is almost certainly a large exaggeration of what is plausibly at stake since many of these people will not vote and 10 percentage points would be a very large shift.
In 2020, Biden’s margin of victory in the state was 1.2 percentage points or 80,000 votes. In this context, the 940 votes plausibly at issue in coal country could matter, but it’s not likely.
What could have a much greater effect is if the Washington Post and other major media outlets can keep up a drumbeat that Biden is indifferent to the plight of ordinary workers. That is how this article is best understood.
Read More Leer más Join the discussion Participa en la discusión
Even though we have had the longest streak of below 4.0 percent unemployment in 70 years, and real wages are rising, especially at the bottom end of the wage distribution, the major media outlets insist the economy is terrible. The Washington Post is setting the pace with the lead story on its homepage headlined “Millennials had it bad financially, but Gen Z may have it worse.”
This one gets pretty creative in telling us how Gen Z has it awful. My favorite is a graph that shows that recent college grads now have a higher unemployment rate than the overall average for all workers. Yeah, that is really horrible. Think of how young college grads must be suffering because older people and those who didn’t graduate college have jobs. Can you feel the hardship?
If we look at the graph, we see that the unemployment rate for recent college grads is actually relatively low at 4.3 percent. This is lower than it was for much of the 1990s, the 2000s, and most of the decade before the pandemic. So, does the Post want us to believe that young college grads are suffering not because they face high unemployment, but because other workers face low unemployment?
The other part of this story that the Post chose not to point out is that, given the relatively low unemployment rate for young people as a whole, the slightly higher rate for college grads means that those without college degrees have unusually low rates. Since most young people don’t have college degrees, this sounds like a good story for Gen Z.
The piece also features a graph showing that inflation adjusted insurance costs and housing costs have outpaced real wage growth, while real food prices have roughly kept even. There are a few points to be made on this graph.
First, it is not clear what housing index they are using. The graph shows real housing costs rising by 115 percent since 1985. The CPI rent index shows real rent increasing by less than 30 percent over this period.
The second point is that it shows real auto insurance costs rising by 145 percent over this period. This is a gross measure of what people pay for insurance, it does not subtract out what they get paid back in claims. The Commerce Department uses a net measure, which shows a still substantial, but considerably smaller 63 percent real increase.
Much of the reason that insurance premiums have gone up so much is that insurers are seeing more and larger claims. Some of this is due to more expensive cars and some of it is due to more climate-related claims, like vehicles being destroyed by fires or flooding. Anyhow, if we have to pay more for insurance because climate change is imposing more damage, that is probably not inflation as we conventionally think of it.
The final point is that the graph shows real wages have risen (as in up) by 33 percent since 1985. Remember, this is a piece that is telling us how bad young people have it today compared to their elders, but it shows us that their real wages are one-third higher than what people got four decades ago.
I would be happy to support the argument that we should have seen faster wage growth. That would have been the case if there had not been so much upward redistribution over the last four decades, but let’s not get caught up in the which-way-is-up problem. Higher real wages mean, as a first approximation, people are better off. That is the wrong direction for the Washington Post’s suffering Gen Z story.
One final point, while the piece spends considerable time on the debt of Generation Z, it chose not to mention President Biden’s income-driven repayment plan for student loan debt. Under this plan, a single person earning less than $32k a year would pay nothing back on their loans and a person earning $40k a year would pay just $60 a month. This should ensure that student loan debt is not a major burden for most borrowers.
For some reason, reporters writing on student debt almost never seem to mention the income-driven repayment plan. This is a bit mind-boggling, but I suppose if you’re trying to pitch the suffering Gen Z story, it is a convenient fact to ignore.
Read More Leer más Join the discussion Participa en la discusión


