The media have told us endlessly how people can no longer afford things due to higher prices and the fact that wages have risen more doesn’t matter. I wouldn’t want to disagree with the experts, but suppose we just did a little calculation about how much time it takes a typical worker to earn enough money to buy a gallon of gas.
Here’s the picture going back a decade.
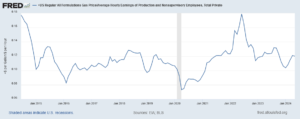
This takes the price of a gallon of gas and divides it by the average hourly earnings for production and non-supervisory workers. This is a category that covers roughly 80 percent of the workforce, but excludes most high-end earners like managers, professionals, and Wall Street types. This means that it cannot be skewed by the big bucks going to the top.
As can be seen, gas prices did jump a lot relative to wages in the spring of 2022, following Russia’s invasion of Ukraine. At the peak, in June of 2022, it took 0.179 hours of work (10.7 minutes) to pay for a gallon of gas.
That was more than twice as high as low hits during the pandemic when the economy was shut down, although it was not that high by historical standards. Gas cost more than 0.20 hours of work (12 minutes) at points in 2011 and it peaked at 0.224 hours of work (13.5 minutes) in July of 2008.
But June 2022 was two years ago, and the oil markets have largely stabilized since then. The most recent figure is 0.12 hours (7.2 minutes). That’s still a lot higher than when the economy was shut down. (Donald Trump seems to think those were glory days – gas was less than $2.00 a gallon, but we couldn’t leave our homes.) But the current 0.12 hours cost of gas doesn’t look bad compared to prior periods.
For example, in 2018, it took as much as 0.128 hours (7.7 minutes) to pay for a gallon of gas. In 2019 gas peaked at 0.122 hours (7.3 minutes) of labor in May. It’s understandable people would want cheaper gas, just like they want higher pay. But the reality is that it is not especially high by historical standards, including what we saw in the recent past.
The spread of electric cars in the U.S. and elsewhere is likely to send gas prices lower in the years ahead. Electric car buyers will of course not especially care about gas prices, but more people buying electric cars will mean cheaper gas prices for those who don’t. (No, that’s not especially fair, just the reality.) Anyhow, the basic story is gas prices are actually pretty low today compared to what people earn, but that doesn’t mean the media should not yell about gas being unaffordable.
The media have told us endlessly how people can no longer afford things due to higher prices and the fact that wages have risen more doesn’t matter. I wouldn’t want to disagree with the experts, but suppose we just did a little calculation about how much time it takes a typical worker to earn enough money to buy a gallon of gas.
Here’s the picture going back a decade.
This takes the price of a gallon of gas and divides it by the average hourly earnings for production and non-supervisory workers. This is a category that covers roughly 80 percent of the workforce, but excludes most high-end earners like managers, professionals, and Wall Street types. This means that it cannot be skewed by the big bucks going to the top.
As can be seen, gas prices did jump a lot relative to wages in the spring of 2022, following Russia’s invasion of Ukraine. At the peak, in June of 2022, it took 0.179 hours of work (10.7 minutes) to pay for a gallon of gas.
That was more than twice as high as low hits during the pandemic when the economy was shut down, although it was not that high by historical standards. Gas cost more than 0.20 hours of work (12 minutes) at points in 2011 and it peaked at 0.224 hours of work (13.5 minutes) in July of 2008.
But June 2022 was two years ago, and the oil markets have largely stabilized since then. The most recent figure is 0.12 hours (7.2 minutes). That’s still a lot higher than when the economy was shut down. (Donald Trump seems to think those were glory days – gas was less than $2.00 a gallon, but we couldn’t leave our homes.) But the current 0.12 hours cost of gas doesn’t look bad compared to prior periods.
For example, in 2018, it took as much as 0.128 hours (7.7 minutes) to pay for a gallon of gas. In 2019 gas peaked at 0.122 hours (7.3 minutes) of labor in May. It’s understandable people would want cheaper gas, just like they want higher pay. But the reality is that it is not especially high by historical standards, including what we saw in the recent past.
The spread of electric cars in the U.S. and elsewhere is likely to send gas prices lower in the years ahead. Electric car buyers will of course not especially care about gas prices, but more people buying electric cars will mean cheaper gas prices for those who don’t. (No, that’s not especially fair, just the reality.) Anyhow, the basic story is gas prices are actually pretty low today compared to what people earn, but that doesn’t mean the media should not yell about gas being unaffordable.
Read More Leer más Join the discussion Participa en la discusión
That’s what readers must conclude after reading this Washington Post’s piece on President Biden’s plans to increase corporate taxes and taxes on the rich. At one point, the piece reports the response to these plans from Rep. Steven Scalise (R-La), the second-ranking Republican in the House:
“He tries to act like it’s not going to affect certain people, but when you raise taxes, it hits everybody, especially low-income families. Look at what his energy policies have done. The people hit the hardest are low-income families paying higher gas prices, paying more at the grocery store and more for their household electricity bills all because of bad Biden policies.”
While it then turns back to people discussing the merits of Biden’s proposals for taxing corporations and the rich, it neglects to point out that Biden’s energy policies have resulted in record levels of oil production.
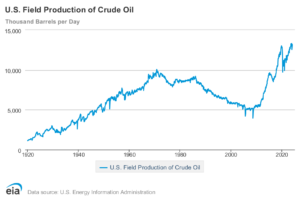
This is a dubious accomplishment for those of us concerned about global warming, but it points out that Scalise’s complaint that Biden’s policies have led to higher gas prices is a lie. The rise in world oil prices, and the resulting increase in gas prices, is primarily due to the robust recovery from the pandemic recession, not Biden’s energy policies.
That’s what readers must conclude after reading this Washington Post’s piece on President Biden’s plans to increase corporate taxes and taxes on the rich. At one point, the piece reports the response to these plans from Rep. Steven Scalise (R-La), the second-ranking Republican in the House:
“He tries to act like it’s not going to affect certain people, but when you raise taxes, it hits everybody, especially low-income families. Look at what his energy policies have done. The people hit the hardest are low-income families paying higher gas prices, paying more at the grocery store and more for their household electricity bills all because of bad Biden policies.”
While it then turns back to people discussing the merits of Biden’s proposals for taxing corporations and the rich, it neglects to point out that Biden’s energy policies have resulted in record levels of oil production.
This is a dubious accomplishment for those of us concerned about global warming, but it points out that Scalise’s complaint that Biden’s policies have led to higher gas prices is a lie. The rise in world oil prices, and the resulting increase in gas prices, is primarily due to the robust recovery from the pandemic recession, not Biden’s energy policies.
Read More Leer más Join the discussion Participa en la discusión
As we enter the fourth decade of the North American Free Trade Agreement (NAFTA), and now its successor, the United States-Mexico-Canada Agreement (USMCA), it is worth taking a quick look at the track record. Folks who can remember back to the debate around the agreement might recall that it was supposed to spur growth in Mexico and allow it to close the income gap with the United States. It hasn’t turned out that way.
The graph below shows the ratio of per capita GDP in Mexico to per capita GDP in the United States going back to 1980.
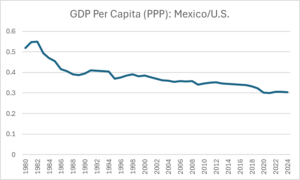
Source: International Monetary Fund.
At the start of this period, Mexico’s per capita GDP was well over half of the per capita GDP in the United States. It then fell sharply over the course of the decade, bottoming out at 38.6 percent in 1989.
There is a simple story here. The price of oil collapsed. Mexico’s economy was booming in the late 1970s as the Iranian revolution sent world oil prices soaring. As oil producing nations sought to ramp up production and the world economy went into recession, oil prices plummeted. Countries like Mexico, which were heavily dependent on oil exports, took a huge hit.
By 1990 the economy had turned the corner and was making at least moderate progress relative to the US, but that ended with a currency crisis at the start of 1994. While the crisis was at most indirectly related to NAFTA, Mexico never recovered the lost ground and continued on a downward relative course.
The ratio of Mexico’s GDP to US GDP had fallen to 35.9 percent by the 10th anniversary of NAFTA in 2004. It dropped further to 34.4 percent by 2014 on the 20th anniversary. The IMF’s projection for 2024 puts Mexico’s per capita GDP at just 30.4 percent of US GDP. Its per capita income grew by 20.3 percent over the last 30 years, an average annual rate of just over 0.6 percent.
GDP growth is not everything. If income is more evenly distributed or the government has prioritized meeting social needs like education and health care, then income gains may understate the benefits to society. But that story does not seem likely with Mexico. In any case, the promise of NAFTA that it would lead to convergence between Mexico and the two richer countries in the pact clearly has not been fulfilled.
As we enter the fourth decade of the North American Free Trade Agreement (NAFTA), and now its successor, the United States-Mexico-Canada Agreement (USMCA), it is worth taking a quick look at the track record. Folks who can remember back to the debate around the agreement might recall that it was supposed to spur growth in Mexico and allow it to close the income gap with the United States. It hasn’t turned out that way.
The graph below shows the ratio of per capita GDP in Mexico to per capita GDP in the United States going back to 1980.
Source: International Monetary Fund.
At the start of this period, Mexico’s per capita GDP was well over half of the per capita GDP in the United States. It then fell sharply over the course of the decade, bottoming out at 38.6 percent in 1989.
There is a simple story here. The price of oil collapsed. Mexico’s economy was booming in the late 1970s as the Iranian revolution sent world oil prices soaring. As oil producing nations sought to ramp up production and the world economy went into recession, oil prices plummeted. Countries like Mexico, which were heavily dependent on oil exports, took a huge hit.
By 1990 the economy had turned the corner and was making at least moderate progress relative to the US, but that ended with a currency crisis at the start of 1994. While the crisis was at most indirectly related to NAFTA, Mexico never recovered the lost ground and continued on a downward relative course.
The ratio of Mexico’s GDP to US GDP had fallen to 35.9 percent by the 10th anniversary of NAFTA in 2004. It dropped further to 34.4 percent by 2014 on the 20th anniversary. The IMF’s projection for 2024 puts Mexico’s per capita GDP at just 30.4 percent of US GDP. Its per capita income grew by 20.3 percent over the last 30 years, an average annual rate of just over 0.6 percent.
GDP growth is not everything. If income is more evenly distributed or the government has prioritized meeting social needs like education and health care, then income gains may understate the benefits to society. But that story does not seem likely with Mexico. In any case, the promise of NAFTA that it would lead to convergence between Mexico and the two richer countries in the pact clearly has not been fulfilled.
Read More Leer más Join the discussion Participa en la discusión
Everyone knows that the Washington Post is owned and controlled by people who will pay lower taxes if Donald Trump gets back into the White House, but couldn’t it at least pretend to be a newspaper?
In a piece discussing the political debate over electric vehicles, the Post told readers: “Trump has vowed to roll back Biden’s electric vehicle efforts and warned ‘you’re not going to be able to sell those cars’ if he becomes president.
…
“It is an easy attack line for Trump, however, who called the Biden regulations ‘ridiculous’ in a recent meeting with oil industry executives who he brazenly asked to raise $1 billion for his campaign.
“At a rally in Las Vegas earlier this month, Trump went on a lengthy rant against electric-powered boats, saying he would have trouble knowing what to do if the boat was sinking in shark-infested waters. ‘Do I get electrocuted if the boat is sinking, water goes over the battery, the boat is sinking? Do I stay on top of the boat and get electrocuted, or do I jump over by the shark and not get electrocuted?’ he asked.
“’I’ll take electrocution every single time,’ he said. ‘I’m not getting near the shark.’”
Contrary to what the Post tells readers, it really should not be “an easy attack line” for Trump. He is on record saying that there will be a “bloodbath” in the auto industry if we allow Chinese EVs to be sold in the United States without high taxes.
This might be too difficult for Donald Trump to understand, but ordinary people can figure out that you would not need high taxes to keep people from buying cars they don’t want. Donald Trump is making the absurd argument that people don’t want to buy EVs, but we need very high taxes to keep them from buying them.
That sort of contradiction on a major political issue would be highly embarrassing for a presidential candidate, if the media could find out about it.
Read More Leer más Join the discussion Participa en la discusión
The belief in free-market fundamentalism runs very deep. When I say that, I don’t mean that support for the concept runs deep, I mean the belief that we had been pursuing free-market policies in the years before the Trump and Biden presidency runs very deep. I was reminded of this fact in a New York Times column by Farah Stockman, touting the development of a new post-free-market fundamentalist paradigm.
To be clear, the period of so-called free-market fundamentalism was one in which we saw a massive upward redistribution of wealth and income as has been extensively documented in numerous studies. It is understandable that the people who are happy about this upward redistribution would like to attribute it to the natural workings of the market.
The story goes, yeah Elon Musk and Bill Gates are very rich, and lots of ordinary workers are kind of screwed, but shit happens. If we feel bad enough about it, we can toss some dimes to the left behind. After all, Bill Gates started a big foundation to help the world’s poor.
That’s a far more generous story for the rich than the reality. It was not just a case of “shit happens,” where the natural workings of the market gave them all the money. It was a story where they actively rigged the rules to ensure that a huge amount of money would be redistributed upward.
The place where I always begin is with government-granted patent and copyright monopolies. It is mind-boggling that serious people can think that these massive forms of government intervention are somehow the “free market.”
And to be clear, there is huge money at issue. In the case of prescription drugs alone the gap between the patent-protected prices we pay and the price drugs would sell for in a free market is likely more than $600 billion a year.
This is more than 2.2 percent of GDP. By comparison, after-tax corporate profits in 2023 were less than $2.7 trillion. And this $600 billion figure is just for drugs. Add in medical devices, software, computers, video games and all the other items where patents or copyrights account for a large share of the price, and we are almost certainly far over $1 trillion a year. Yet we are supposed to believe that this is just the free market here?
It is also important to recognize that we could use other mechanisms than these monopolies for supporting innovation and creative work. We can and do have direct public funding or tax credits in various forms. We can also make the patent and copyright protections we have shorter and weaker, rather than longer and stronger, as has been the case over the last half-century.
This is far from the only area where the government has played a huge role under “free-market fundamentalism.” While we were ostensibly pushing a free trade agenda, we did little or nothing to reduce the trade barriers that protect our most highly paid professionals, like doctors and dentists, from international competition.
As a result, these professionals are paid more than twice as much here as their counterparts in other wealthy countries. We would save close to $150 billion a year (more than $1000 per family) if we paid our doctors the same salaries they get in Germany or Canada.
Our policies were never about free trade. They were about selective protectionism, where we expose manufacturing workers to direct competition with low-paid workers in the developing world, but we protect our most highly-paid professionals from the same sort of competition.
Again, it’s not surprising that the winners from this policy would like to call it “free trade.” That sounds much better than structuring trade to make the rich richer. But why would opponents of this policy accept this dishonest terminology?
The UAW strike last fall highlighted the huge disparity in pay between the CEOs at the Big Three auto companies and the pay of top execs at the major auto companies in Europe and Japan. Our top execs get roughly four times the pay of their counterparts at European car companies and, in the extreme case, ten times as much as their pay at Japanese companies.
This gap in pay is not explained by differences in size and profitability. The European and Japanese car companies are every bit as big and profitable as the U.S. companies. They just have different rules of corporate governance that make it more difficult for the CEOs and other top executives to rip off the companies they work for. And rules of corporate governance are not set by the free market, they are set by governments.
The massive fortunes in the financial sector are only possible because the government has rigged the rules to encourage a bloated financial sector. If there was a tax on financial transactions, similar to the sales tax most of us pay when we buy food or clothes, the sector would be far smaller and there would be many fewer Wall Street millionaires and billionaires. The free market didn’t tell us to exempt the financial sector from the taxes most other sectors pay.
Similarly, tax rules, like the carried interest deduction, along with bankruptcy laws that are very favorable to corporate debtors, provide much of the basis for the fortunes earned by hedge fund and private equity partners. These were given to us by the lobbying of powerful interests, not the free market.
Facebook, X, TikTok, and other social media giants are able to thrive in large part because of their Section 230 protections. Here also Section 230 came to us from corporate lobbyists, not the free market.
It is hard to understand why we have this obsession in intellectual circles that we have been living through a long period of market fundamentalism. It is a lie and it should not be perpetuated, especially now that people are declaring its demise.
This is not just a semantic point. It speaks to the issue of how we want to structure the economy. If we fail to recognize that there is no such thing as a “free market,” then we are not thinking seriously about the economy.
The government always must structure the market. It is literally infinitely malleable. If we think of the options as government versus the free market, then we don’t understand what we are dealing with and it is likely to end badly.
(Yes, this is my book Rigged [it’s free]. There’s also the video version.)
Read More Leer más Join the discussion Participa en la discusión
If we wanted to know what the job market looks like for recent college graduates, we would probably start by looking at their unemployment/employment rates. On the other hand, if we wanted to try to make the labor market for recent college grads look bad, we could follow the Washington Post’s lead and look at the re-employment rates for college grads who report being unemployed.
While the latter statistic is interesting, it only tells us about the employment prospects for the roughly 4.0 percent of college grads who report being unemployed in any given month. It tells us nothing about the job prospects for the 96 percent of college grads in the labor market who have jobs.
As it turns out, the prospects for recent college grads who end up being unemployed are not very good. This is what the Washington Post chose to highlight in a piece headlined, “Degree? Yes. Job? Maybe Not Yet.”
The article starts out by talking about the re-employment rate for new entrants to the workforce and shows us that it is far lower than for more experienced workers. This is shown with a large graph.
Next in the piece we do get the employment rate for all young people, not just recent grads, which has fallen in recent months back to levels reached in 2016, after previously reaching levels that were close to pre-pandemic peaks.
It is only towards the bottom of the piece that we get the unemployment rate for recent grads (4.3 percent). This is up slightly from the 3.9 percent low hit in 2022, but still low by most standards and very comparable to the rates we saw just before the pandemic.
As a practical matter, it is hard to imagine that someone could look at a 4.3 percent unemployment rate and say college grads are having a hard time finding jobs. Oddly, this is the second time in two weeks we saw this re-employment rate for recent grads highlighted as meaning that college grads are having trouble getting jobs.
The market for recent college grads continues to look pretty good, but the market for bad news on the economy is red hot.
Read More Leer más Join the discussion Participa en la discusión
That’s a bit of an exaggeration, but the Consumer Price Index (CPI), excluding owners’ equivalent rent (OER) fell to 1.4 percent in June 2023 and has remained pretty close, but mostly above 2.0 percent ever since. We all know the Fed targets the Personal Consumption Expenditure Deflator, where the OER has a smaller weight, but it is still worth seeing how much this one category affects the CPI.
OER is not just a major expenditure category, it is also unusual in the sense that literally no one pays it. This is the rent that homeowners would be paying themselves if they had to rent the home they lived in. For this reason, it’s probably fair to say that no one considers themselves worse off because OER has risen. (They may consider themselves poorer because the cost of buying a home has increased, but that is a somewhat different question.)
Anyhow, here is the picture since the start of 2020.[1]
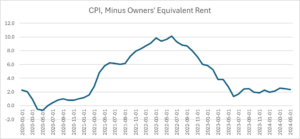
Source: Bureau of Labor Statistics and Author’s Calculations.
As can be seen, just before the pandemic inflation minus OER was actually slightly above the Fed’s 2.0 percent target. With the pandemic shutdowns, it plunged and even briefly turned negative. It then accelerated sharply in early 2021 as supply chain issues sent inflation soaring. OER actually dampened inflation somewhat as it was peaking in the spring of 2022. It would have scraped into the double-digits in June 2022. It then fell sharply over the next year, bottoming out at 1.4 percent in June of 2023. Since then, it has bounced around some but remained reasonably close to 2.0 percent.
Apart from the issue that no one pays OER, there is a reason to be interested in the CPI excluding both the current OER measure as well as the measure of rent proper. We know that inflation in both measures will be headed sharply lower in the months ahead because the indexes that measure the rents on units that change hands are showing sharply lower rents.
The CPI rental indexes are being held up now by leases signed one or more years ago. When these leases are up for renewal, they will show much lower increases, and many may report rent declines. As these new leases get incorporated into the CPI, the inflation shown in its rental indexes will fall sharply, possibly near zero. Instead of being a factor pushing up the overall inflation rate, rent may be a factor pulling it down.
[1] To calculate the CPI without OER, I averaged the relative importance of January of each year and January of the following year and applied it as the weight assigned to year-over-year OER inflation in each month of that year. For 2024, I just used the January relative importance for the first five months of the year.
That’s a bit of an exaggeration, but the Consumer Price Index (CPI), excluding owners’ equivalent rent (OER) fell to 1.4 percent in June 2023 and has remained pretty close, but mostly above 2.0 percent ever since. We all know the Fed targets the Personal Consumption Expenditure Deflator, where the OER has a smaller weight, but it is still worth seeing how much this one category affects the CPI.
OER is not just a major expenditure category, it is also unusual in the sense that literally no one pays it. This is the rent that homeowners would be paying themselves if they had to rent the home they lived in. For this reason, it’s probably fair to say that no one considers themselves worse off because OER has risen. (They may consider themselves poorer because the cost of buying a home has increased, but that is a somewhat different question.)
Anyhow, here is the picture since the start of 2020.[1]
Source: Bureau of Labor Statistics and Author’s Calculations.
As can be seen, just before the pandemic inflation minus OER was actually slightly above the Fed’s 2.0 percent target. With the pandemic shutdowns, it plunged and even briefly turned negative. It then accelerated sharply in early 2021 as supply chain issues sent inflation soaring. OER actually dampened inflation somewhat as it was peaking in the spring of 2022. It would have scraped into the double-digits in June 2022. It then fell sharply over the next year, bottoming out at 1.4 percent in June of 2023. Since then, it has bounced around some but remained reasonably close to 2.0 percent.
Apart from the issue that no one pays OER, there is a reason to be interested in the CPI excluding both the current OER measure as well as the measure of rent proper. We know that inflation in both measures will be headed sharply lower in the months ahead because the indexes that measure the rents on units that change hands are showing sharply lower rents.
The CPI rental indexes are being held up now by leases signed one or more years ago. When these leases are up for renewal, they will show much lower increases, and many may report rent declines. As these new leases get incorporated into the CPI, the inflation shown in its rental indexes will fall sharply, possibly near zero. Instead of being a factor pushing up the overall inflation rate, rent may be a factor pulling it down.
[1] To calculate the CPI without OER, I averaged the relative importance of January of each year and January of the following year and applied it as the weight assigned to year-over-year OER inflation in each month of that year. For 2024, I just used the January relative importance for the first five months of the year.
Read More Leer más Join the discussion Participa en la discusión
New York Times columnist Peter Coy did a piece yesterday questioning the existence of a gap between productivity growth and the typical worker’s pay. This gap was established decades ago by my friends and former colleagues at the Economic Policy Institute (EPI). The fact that it is now being questioned says a lot about economics and even more about politics in this country.
First, let me be clear, my purpose is not to beat up on Coy. I’ve known him for many years and consider him a very good reporter/columnist who tries to get things right. The fact that he could be caught up in this mud-throwing effort speaks volumes about the influence of well-funded conservative think tanks and their ability to push their agenda even when it has no basis in reality.
The Productivity-Pay Gap, What Is at Issue?
When my former boss at EPI, Larry Mishel first began to write about the gap between productivity and pay, more than three decades ago, he was always very clear: the gap was between the productivity growth and the pay of the median or typical worker.
He and various colleagues at EPI, including Jared Bernstein, John Schmitt, Josh Bivens, Heidi Shierholtz, Sylvia Allegretto, and Elise Gould, were always pointing out that the gap was not between productivity and average pay, the source of the gap was within the wage distribution. In other words, money was going from workers at the middle and the bottom to workers at the top, like CEOs and Wall Street types, not from wages to profits.
For this reason, it was a bit jarring to read that there is little gap between productivity and average wages as some sort of revelation. We all knew this for several decades. (This is why some of us are less than convinced about the stories of excess monopoly power being the big issue in the economy. That would better fit a story of the money going to profits, not high-end workers.)
The other aspects of the ostensible controversy have long been dealt with by EPI and others. (I have written on the issue a couple of times over the years.) We typically use the Consumer Price Index to deflate wages while we use the GDP deflator to calculate productivity. The latter generally shows a lower rate of inflation than the former, which could explain some of the gap. To get around this issue, it’s necessary to use a common deflator, which I have done, as has EPI in its more recent analyses. It barely changes the story.
There is also an issue that an increasing share of compensation is going to non-wage benefits like employer-provided health care insurance. Actually, this was mostly a story in the 1980s and 1990s, not in this century. In any case, we deal with this by assuming that the median worker gets the same share of their compensation in non-wage benefits as the average worker.
Coy also raises the bizarre issue that EPI looks at growth in economy-wide productivity, rather than just the non-farm business sector. The issue, which was apparently raised by some of the conservative economists he consulted, is that this includes housing, which involves very little labor and therefore implicitly has high productivity.
It’s not clear what point they were attempting to make, but as a practical matter their argument goes the wrong way for their point. EPI is comparing the growth in productivity with the growth in real wages. The growth in economywide productivity has generally been slower than the growth of productivity in the non-farm business sector over the last half-century. Using this measure for productivity reduces the gap between productivity and wages.
In short, none of the issues raised by Coy is at all new. They have been well-known for decades and thoroughly addressed by EPI. The big issue is that they are now raised again in the country’s leading newspaper to muddy the waters around a long-established fact. It’s a bit like someone digging up old and long-refuted criticisms of Johannes Kepler’s theory of a sun-centered solar system.
Distracting from the Real Issue
As EPI and others have always contended, the question is why we had a quarter-century-long period of rapid growth (1947-1973), where the gains were broadly shared, to a period of slower growth where a disproportionate share of the gains went to high-end workers. Coy notes comments from the conservative economists that this just reflects the greater productivity of high-end workers.
But this misses the point. Productivity is determined by how we structure the economy. It is not an intrinsic feature of individual workers.
Starting with my favorite example, government-granted patent and copyright monopolies, and the fact that we have made them longer and stronger over the last half-century, have a huge impact on the “productivity” of the workers best situated to benefit from them. To take my poster child, how rich would Bill Gates be in a world where the government did not threaten to arrest anyone who copied Microsoft’s software without his permission? He would likely still be working for a living in that situation. (Okay, he might be collecting his Social Security now.)
There are millions of workers who collect much larger paychecks than would be the case if we had different rules on patents, copyrights, and other forms of intellectual property (IP). These rules are very much a policy choice, not an inherent feature of the economy. And just to connect the dots, higher prices for items like prescription drugs, medical equipment, software, computers, etc. mean lower real wages for everyone not benefitting from the IP rules.
A second way that we have structured the economy to redistribute income upward is to foster the growth of a bloated financial sector. In the mid-1970’s, the narrow financial sector (securities and commodities trading and investment banking) was about 0.4 percent of GDP. Today it is around 2.2 percent ($600 billion a year). Many of the country’s biggest fortunes are earned in the financial sector, and the major banks and private equity funds have plenty of people pocketing millions or tens of millions annually.
Here too the laws have an enormous impact. If we had financial transactions taxes, similar to the sales taxes most of us pay on food, clothes, and other items, we would have much less of our money going from our pockets to the Wall Street crew. Similarly, if we did not structure bankruptcy law to be so user-friendly, private equity companies would have much less fun taking over corporations and stripping their assets.
We also have structured our rules of corporate governance so that the CEOs and other top executives can rip off the companies they work for. One of the most striking items that got attention in the UAW strike last fall, was how much less money the top executives of the major car makers in Europe and Japan get paid than the CEOs of the Big Three here.
These are companies that are every bit as large and often more profitable than the Big Three. Yet their top executives get paid far less. In the extreme case, the CEO of Honda got less than one-tenth the pay of the CEO of GM.
This is due to a corrupt corporate governance structure where boards of directors see themselves as allies of top management, not agents of shareholders looking to rein in excessive compensation. The best story here is Elon Musk’s effort to get $55 billion out of Tesla, almost as much as the aid package for Ukraine.
According to advanced economic theory, more pay for top executives means less money for everyone else. And just to be clear, the excessive pay goes beyond the CEO. If the CEO gets $25 million, the other top execs likely get $10 million to $15 million, and the next tier can get paychecks in the single-digit millions.
Then we get the selective protectionism commonly known as “free trade.” This is selective protectionism because our trade policy has been structured to place manufacturing workers in direct competition with low-paid workers in the developing world. This has the predicted and actual effect of pushing down their wages, largely eliminating the manufacturing wage premium. Since manufacturing had historically been a source of good-paying jobs for workers without college degrees, this lowered the pay of less-educated workers more generally.
We could have applied free trade policies to professions that employed highly educated workers, like doctors and dentists. These professionals here earn two or three times as much as their counterparts in other wealthy countries. All the arguments for gains from trade would apply big-time to plans to make it easier for foreign-trained professionals to work here, but such proposals are nowhere on our policy agenda.
On the other side, full employment policies disproportionately benefit workers at the bottom end of the wage ladder. Many of us have long argued for these policies and we clearly see the impact with the strong economy of the last few years. Unions also make a huge difference in the pay of their members. And, if the minimum wage had kept pace with productivity growth, as it did between 1938 and 1968, it would be over $26 an hour today.
To be clear, when workers were getting the much higher minimum wage in 1968, relative to the economy’s average productivity, they must have been at least as productive as their pay, or they would not have been hired. (The unemployment rate was under 4.0 percent in 1968.) In short, productivity is far from some inherent characteristic of individual workers, it is the result of how we structure the economy.
Anyhow, this is a long detour from the debate over the productivity-pay gap, but it is where the discussion needs to take place. (Yes, this is the topic of my book Rigged [it’s free].) The right-wing economists challenging EPI’s analysis are just blowing smoke and trying to hide the real issues. We need to talk about how we have structured the economy to increase inequality within the wage distribution, and not pretend that this problem does not exist.
Read More Leer más Join the discussion Participa en la discusión
This is a bit nitpicky, but still a point worth making. If the unemployment rate came in below 4.0 percent in May, it would have been the 28th consecutive month of below 4.0 percent unemployment, beating the 27-month streak in the late 1960s boom. Unfortunately, the rate ticked up to 4.0 percent, so it seems that we just tied the 1960s streak.
However, if we go behind the rounding, the unemployment rate was actually 3.96 percent in May, still under 4.0 percent. This means that we did have 28 consecutive months of below 4.0 percent unemployment.
I’ll leave this one for the refs to determine, but I did want to get the numbers right.
Read More Leer más Join the discussion Participa en la discusión
It has been popular for people commenting on the state of the economy to say that consumers have to pull back on consumption because they have exhausted their savings. A big part of this story is that the saving rate is supposedly near a record low.
The reported saving rate, at 3.8 percent in the first quarter, is in fact very low, But treating this as a good measure of savings misunderstands the National Income and Product Accounts.
The first point to understand is how saving is measured. The saving rate does not measure money put into a savings account; it is simply a residual. The Commerce Department estimates disposable income, and then subtracts consumption. What is left is “savings.”
This definition is important to keep in mind if we are trying to get the story right. In recent quarters, we have had an unusually large and positive “statistical discrepancy” in the GDP accounts. The statistical discrepancy is the gap between GDP measured on the output side and the income side.
In principle, we can measure GDP by adding up the value of everything sold, whether as consumption items, investment, government purchases, or net exports. We can also measure GDP by adding up the income generated in the production process, wages, profits, interest, and rent.
We should get the same number either way, but in a $28 trillion economy the sums never come out exactly equal. In recent quarters the output side has been considerably larger than the income side. In the first quarter, the output side measure was 2.2 percent higher than the income side measure.
At this point, we don’t know which measure is closer to the true number, but for calculating the saving rate, it doesn’t matter. Either way, the saving rate has been substantially understated.
Suppose that the income side is correct, and output has been overstated by 2.2 percentage points. This means that the output components of GDP have been overstated, which means that consumption, which is more than 70 percent of GDP, has been overstated. If consumption has been overstated by 2.2 percent, then saving has been understated by roughly 2.2 percentage points. That would mean the true saving rate would be close to 6.0 percent.
Let’s assume the opposite; that the output side number is closer to the true number. In that case income is roughly 2.2 percent higher than currently reported. In that case, since consumption is unchanged, but disposable income is 2.2 percent higher, then the saving rate would again be roughly 2.2 percentage points higher, again putting it close to 6.0 percent.
The true number for GDP is likely somewhere in the middle, but the exact point doesn’t matter. The true saving rate is roughly 2.2 percentage points higher than the reported saving rate. That puts it equal to the 5.9 percent saving rate in the three years before the pandemic.
In short, when someone tells you that the saving rate is near a record low, they are telling you that they don’t understand the national accounts. They are not actually telling you about the saving rate.
Read More Leer más Join the discussion Participa en la discusión