


The Federal Reserve Board raised interest rates last week and seem poised to do so again in the not distant future. The rationale is that the economy is now near or at full employment and that if job growth continues at its recent pace it will lead to a harmful acceleration in the inflation rate.
We have numerous pieces raising serious questions about whether the labor market is really at full employment, noting for example the sharp drop in employment rates (for all groups) from pre-recession levels and the high rate of involuntary part-time employment. But the story of accelerating inflation is also not right.
This is particularly important, since John Williams, the president of the San Francisco Federal Reserve Bank, cited accelerating inflation as a reason to support last week’s rate hike, and possibly future rate hikes, in an interview in the New York Times this morning. Williams has been a moderate on inflation, so there are many members of the Fed’s Open Market Committee who are more anxious to raise rates than him.
A close look at the data does not provide much evidence of accelerating inflation. The core PCE deflator, the Fed’s main measure of inflation, has risen 1.7 percent over the last year, which is still under the 2.0 percent target. This target is an average, which means that the Fed should be prepared to allow the inflation rate to rise somewhat above 2.0 percent, with the idea that inflation will drop in the next recession.
Anyhow, the 1.7 percent rate is slightly higher than a low of 1.3 percent reached in the third quarter of 2015, but it is exactly the same as the rate we saw in the third quarter of 2014. In other words, there has been zero acceleration in the rate of inflation over the last two years.
Furthermore, even this modest acceleration has been entirely due to the more rapid increase in rent over the last two years. The inflation rate in the core consumer price index, stripped of its shelter component, actually has been falling slightly over the last year. It now stands at 1.1 percent over the last year.
Core CPI, Minus Shelter
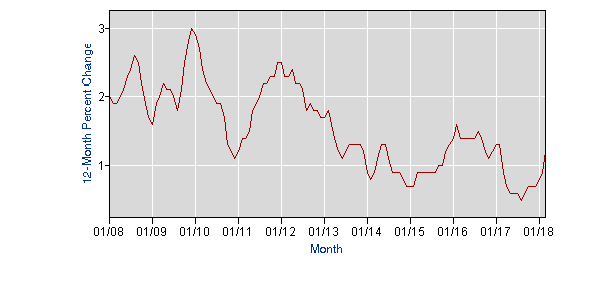
Source: Bureau of Labor Statistics.
It is reasonable to pull shelter out of the CPI because rents do not follow the same dynamic as most goods and services. In fact, higher interest rates, by reducing construction, are likely to increase the pace of increase in rents rather than reduce them.
This issue is hugely important, since if the Fed prevents the labor market from tightening further, it will be preventing millions of people from getting jobs. These people are disproportionately African American and Hispanic and also less-educated workers. The decision to tighten will also lessen the bargaining power of a much larger group of workers, making it more difficult for them to get pay increases.
The weak labor market of the Great Recession resulted in a large redistribution from wages to profits. The tightening of the labor market in the last two years has reversed part of this shift. If the Fed raises interest rates enough to prevent further tightening, then it will be locking in place this redistribution to profits. That would be bad news for tens of millions of workers, especially if the decision was based on a misreading of inflation data.
The Federal Reserve Board raised interest rates last week and seem poised to do so again in the not distant future. The rationale is that the economy is now near or at full employment and that if job growth continues at its recent pace it will lead to a harmful acceleration in the inflation rate.
We have numerous pieces raising serious questions about whether the labor market is really at full employment, noting for example the sharp drop in employment rates (for all groups) from pre-recession levels and the high rate of involuntary part-time employment. But the story of accelerating inflation is also not right.
This is particularly important, since John Williams, the president of the San Francisco Federal Reserve Bank, cited accelerating inflation as a reason to support last week’s rate hike, and possibly future rate hikes, in an interview in the New York Times this morning. Williams has been a moderate on inflation, so there are many members of the Fed’s Open Market Committee who are more anxious to raise rates than him.
A close look at the data does not provide much evidence of accelerating inflation. The core PCE deflator, the Fed’s main measure of inflation, has risen 1.7 percent over the last year, which is still under the 2.0 percent target. This target is an average, which means that the Fed should be prepared to allow the inflation rate to rise somewhat above 2.0 percent, with the idea that inflation will drop in the next recession.
Anyhow, the 1.7 percent rate is slightly higher than a low of 1.3 percent reached in the third quarter of 2015, but it is exactly the same as the rate we saw in the third quarter of 2014. In other words, there has been zero acceleration in the rate of inflation over the last two years.
Furthermore, even this modest acceleration has been entirely due to the more rapid increase in rent over the last two years. The inflation rate in the core consumer price index, stripped of its shelter component, actually has been falling slightly over the last year. It now stands at 1.1 percent over the last year.
Core CPI, Minus Shelter
Source: Bureau of Labor Statistics.
It is reasonable to pull shelter out of the CPI because rents do not follow the same dynamic as most goods and services. In fact, higher interest rates, by reducing construction, are likely to increase the pace of increase in rents rather than reduce them.
This issue is hugely important, since if the Fed prevents the labor market from tightening further, it will be preventing millions of people from getting jobs. These people are disproportionately African American and Hispanic and also less-educated workers. The decision to tighten will also lessen the bargaining power of a much larger group of workers, making it more difficult for them to get pay increases.
The weak labor market of the Great Recession resulted in a large redistribution from wages to profits. The tightening of the labor market in the last two years has reversed part of this shift. If the Fed raises interest rates enough to prevent further tightening, then it will be locking in place this redistribution to profits. That would be bad news for tens of millions of workers, especially if the decision was based on a misreading of inflation data.
Read More Leer más Join the discussion Participa en la discusión
Read More Leer más Join the discussion Participa en la discusión
It really is hard to kill a false story on the state of the economy. The Economic Cycle Research Institute (ECRI) produced a report which purported to show that minorities were getting all the new jobs created by the economy and that whites were actually losing jobs. This report was made the central theme in a column by Eduardo Porter in the New York Times on Wednesday.
I pointed out that this conclusion was driven by demographics. While the number of prime age (ages 25–54) people had increased for the other demographic groups included in the analysis, it had fallen sharply for whites. This meant that the decline in employment for whites did not come from worsening labor market conditions, but rather whites retiring as they reached their sixties.
ECRI then did new analysis that looked at employment-to-population ratios (EPOPs) by age and compared November 2007 to November 2016. This showed a decline of 2.0 percentage points in the EPOP for prime age whites, while showing a modest 0.3 percentage point rise for African Americans. Porter highlighted this in a new piece on Friday. Porter also noted that ECRI find a rise in African American employment rates for the 55 to 64 age group, in contrast to a modest decline for whites in this age group.
The problem with this comparison is that the black employment data is extremely erratic so comparing single months of data can give a misleading picture. This turns out to be the case here.
As I noted, if we compare the first 11 months of 2016 with the first 11 months of 2007, the EPOP for prime age African Americans fell by 1.7 percentage points, almost the same as the 2.0 percentage point drop for whites. The decline in the EPOP for African Americans between the ages of 55 and 64 was actually slightly larger than the decline for whites in this age group.
Unfortunately, the Washington Post chose to highlight the response of ECRI to the initial complaints without checking with anyone familiar with the data. This leaves the mistaken impression that whites have fared worse than other demographic groups since the collapse of the housing bubble.
The take away is that workers, and especially workers without college degrees, have fared poorly in recent years. This gives them ample grounds for complaining about the course of the economy. However, white workers have not fared notably worse than non-whites.
Read More Leer más Join the discussion Participa en la discusión
A Washington Post article headlined, “[w]hy so many U.S. manufacturers are putting up ‘help wanted’ signs” might have led readers to believe that this is a great time for anyone looking for a job in manufacturing. That is not the case, according the Job Openings and Labor Turnover Survey (JOLTS) from the Bureau of Labor Statistics.
According to the JOLTS data, the job opening rate in manufacturing has been 2.6 percent for the last three months. This is small decline from the rate earlier in the year. The same rate was reported for three months in 2012 and two months in 2007. In two other months in 2007 the rate was 2.7 percent.
The article also tells readers that manufacturers have been raising wages as part of their effort to attract workers. The Bureau of Labor Statistics reports that the average hourly wage for production and non-supervisory workers in manufacturing rose 2.7 percent over the last year. This compares to an increase of 2.4 percent in the economy as a whole.
Read More Leer más Join the discussion Participa en la discusión
I enjoy reading Eduardo Porter’s columns in the NYT and usually learn a lot from them, but I think he has made a mistake in arguing that white workers have fared worse in the recession and recovery than African Americans. In his Wednesday piece, he included a chart showing employment among whites had actually fallen by roughly 700,000 since November of 2007, while it had risen by more than 2 million for both African Americans and Asian-Americans and by twice this amount for Hispanics. This seemed to suggest a radically worse labor market experience for whites than for other groups.
After several people asked me about this chart, I checked the change in the working age (ages 16–64) population for each group. The number of whites in this age grouping had fallen by more than 2 million between 2010 and 2015, while the number of African Americans had risen by 1.4 million and the number of Asians had risen by 1.7 million. I’m sure the number of Hispanics grew even more, but these data are on a different table. In other words, the differences in the number of people working by demographic group reflected less their differences in labor market outcomes than their different population trends.
Porter has a piece today responding to this issue, the headline of which tells readers, “across age groups, whites fared worse in employment rates.” The problem is that the data really don’t support this claim. Porter notes that the percentage of prime age (ages 25–54) white workers who were employed fell by 2.0 percentage points from November 2007 to November 2016. By comparison, “[l]ast month 74.5 percent of prime-aged blacks held a job, 0.3 percentage points more than in November 2007.”
While that would seem to suggest that African Americans had a sharply different experience from whites, this conclusion rests on comparing single months in a very erratic data set. If we take the first 11 months of 2016, we find that the EPOP for prime age blacks was 73.2 percent. This is down by 1.7 percentage points from the 74.9 percent average for the first 11 months of 2007. This is only slightly better than the performance of the EPOP for whites, and of course starts from a lower level.
The same problem arises with the comparison of the 55 to 64 age group.
“The employment rate of whites from the ages of 55 to 64 declined slightly — to 63.6 percent from 64.1 percent. By contrast, the employment rate of blacks, Hispanics and Asians increased.”
Taking the first 11 months of both years, the EPOP for African Americans declined by 0.7 percentage points, from 52.7 percent to 52.0 percent. This is actually slightly larger than the decline for white workers.
I am leaving Hispanics out, both because I don’t have immediate access to their EPOPs by age group and because their EPOPs are likely to follow a different pattern due to immigration flows. Immigrants who have difficulty getting a job are likely to leave and others will not come if they face dismal job prospects. Asian-Americans actually saw a sharper decline in prime-age EPOPs than whites, as Porter notes.
To be clear, I think Porter is right in seeing support for Trump as being to a substantial extent a response to bad economic prospects. But the economic prospects of working-class whites in the last decade were not notably worse than the prospects of working-class blacks. The difference in their voting patterns can be explained by the fact that working-class whites who feel they are being left behind by the economy can see hope in a white nationalist like Trump, working-class blacks, Hispanics, and Asian-Americans cannot.
Read More Leer más Join the discussion Participa en la discusión
Eduardo Porter used his column to point out that Donald Trump got support from many whites who felt that they were being left behind. While there is evidence to support this view, one item in the piece may have misled readers.
The column includes a table showing the change in employment since the start of the recession for white, African Americans, Hispanics, and Asians. While the latter three groups all had increases in employment of at least 2 million, employment for whites fell by almost 1 million.
This can be misleading since the main reason for the difference is that the number of working-age whites actually fell during this period, while the number of working-age people in these other groups rose. The Census Bureau reported that there were 125.2 million non-Hispanic whites between the ages of 18 and 64 in 2010. In 2015 this number was down to 122.9 million. By contrast, the number of non-Hispanic African Americans rose from 24.2 million to 25.6 million. The number of Asians in this age band rose from 10.1 million to 11.8 million. There was a considerably larger rise in the number of Hispanics over this period.
In short, this was a period of weak employment growth, but workers from all demographic groups suffered. The numbers in this piece give a misleading picture in implying that white workers suffered disproportionately.
Read More Leer más Join the discussion Participa en la discusión
Cokie Roberts outlined the history of the Electoral College in a discussion in a Morning Edition segment this morning. At the end of the segment, she was asked whether she would favor getting rid of the Electoral College and instead just having presidents elected by the direct popular vote. (Donald Trump lost in this category by more than 2.5 million votes.)
Roberts said no, that she would keep the Electoral College. Strangely, her argument was that she wanted to enhance the importance of minorities. She claimed that the Electoral College made the minority vote very important in key swing states.
While this is true, a recent analysis by Andrew Gelman and Pierre-Antoine Kremp showed that swing states are whiter on average than the nation as a whole. The basic story is that several large uncontestable states, such as California, are disproportionately minorities, while several of the swing states, such as New Hampshire and Iowa, are overwhelmingly white. This means that a focus on the outcomes in swing states will tend to reduce rather than increase the focus on minorities.
It is also worth noting that if we ignored the likelihood that a state would be a swing state and just examined how the Electoral College skews the importance of votes, it also works to the disadvantage of minorities. The reason is that the states with small populations, like Wyoming and Montana, which are over-represented in the Electoral College, are overwhelmingly white. By this measure also, the Electoral College does not work to the benefit of minorities.
It would have also been worth mentioning the National Popular Vote drive. This is an effort to get states to agree to award their electors to the winner of the national popular vote. It would take effect as soon as states representing a majority in the Electoral College agreed to assign their electors based on the outcome of the popular vote. States that account for 165 of the needed 270 votes have made this commitment thus far. This is the most plausible path at present for turning to a direct popular vote for president. It would have been useful to mention it in a segment like this.
Read More Leer más Join the discussion Participa en la discusión
The headline of a Washington Post article told readers:
“Trump is skipping his press conference to focus on his picks for agriculture and the VA.”
Of course, the Washington Post does not actually know why Donald Trump skipped his press conference. It knows why he said that he skipped his press conference. As the article itself suggests, the reason given for missing the press conference may not in fact be the real reason.
It would be helpful if the Post just reported what it knew to be true rather than implying that Donald Trump’s claims are in fact truthful. It also would have been useful if it had mentioned the purpose of the cancelled press conference. This was supposed to be the conference in which he disclosed his plans for his business empire while he is president. Trump claims that he will set up an arrangement that will prevent conflict of interest problems.
Thanks to Robert Sadin for calling this to my attention.
Read More Leer más Join the discussion Participa en la discusión
The supporters of the TPP and recent trade deals are licking their wounds and preparing their counter-attack. Rather than thinking about things like maybe structuring trade deals in ways that don’t disadvantage large segments of the population (yes, this can be done — have free trade for doctors and other highly paid professionals and reduce patent and copyright protection — all in my book, Rigged [it’s free]), they are focusing on new messaging for more of the same. The new messaging does not necessarily involve being truthful.
Hence, the Washington Post made a tool to show “how Donald Trump’s offshoring tariff might affect your shopping.” The tool is a calculator that shows how much Donald Trump’s promised 35 percent tariff on the re-importing of offshored products will raise prices. If you click on, it shows that the retail price of the product is increased by 35 percent. For example, the price of the Carrier air conditioner, that the manufacturer had planned to make in Mexico, would rise by $800 from the $2,400 price listed by Amazon.
The problem with this story is that the basis for the calculation in the Post’s “tool” is the retail price of the product. The basis for the tariff would be the wholesale price of the imported product, which would not include shipping costs, the markup of the retailer, nor many other costs that customers would be paying when they buy it from Amazon. As a ballpark number, the basis for the tariff would likely be in the neighborhood of half of the price that Amazon is listing.
I have said it many times before, and I’ll say it again here, Donald Trump’s plan for company specific tariffs for outsourced items is completely hare-brained. It would be easy to avoid and is hardly a substitute for serious trade policy. But this is not an excuse for making up stories to scare people. The way to have a serious debate on trade policy is to have a serious debate on the issues, not dumping manure on the people who disagree with you.
Read More Leer más Join the discussion Participa en la discusión
This is really embarrassing, I’m having Robert Samuelson do my work for me. His column today pointed out that a Washington Post piece from last week may have misled readers on the amount of waste in the Pentagon’s operations.
That article referred to $125 billion in waste that was identified in an internal Pentagon report that was never made public. This figure is then compared with the $580 billion annual budget for the Defense Department.
The problem is that the $125 billion is a cumulative sum over a five-year period. While the piece does identify it that way, it is likely that many readers would be prone to compare the $125 billion in waste identified by the report with the annual budget, rather than taking the implied $25 billion annual figure. The latter figure would imply that just over 4.0 percent of total spending fell into this waste category, while the full $125 billion figure would be more than one-fifth of spending.
Samuelson was right to call attention to this issue. There is no reason the Post could not have been clear in putting these numbers in an apples to apples context, either highlighting the amount of money spent annually that is identified as waste or comparing the $125 billion figure to five-year spending.
Remember, the point is supposed to be informing readers.
Read More Leer más Join the discussion Participa en la discusión


