


The NYT had an article presenting the comments of several people genuflecting over the lack of public support for current trade policy (wrongly referred to as “free trade”). The obvious reason for this lack of support, which is overlooked by those cited in the article, is that the intention and the outcome of trade policy has been to redistribute income upward.
The point of making it as easy as possible to move a factory to Mexico, and then import the output back to the United States, is to get access to low cost labor. The predicted and actual effect of this policy is to reduce the number of jobs available to manufacturing workers in the United States. This puts downward pressure on their wages, as fans of Econ 101 everywhere know. And, since manufacturing is a traditional source of high-wage employment for workers without college degrees, the loss of manufacturing jobs to Mexico and other developing countries puts downward pressure on the wages of non-college educated workers more generally.
For some reason, the NYT and other news outlets never point out that the “free traders” seem to have no problem with protectionist measures that benefit highly-educated professionals. For example, foreign doctors are prohibited from practicing medicine in the United States unless they complete a U.S. residency program. As a result, our doctors are paid twice as much as doctors in other wealthy countries (more than $250,000 a year on average, net of malpractice insurance and other expenses). This costs the country almost $100 billion a year in higher health care costs (@ $700 per family, per year).
We prohibit dentists from practicing in the United States unless they graduate from a U.S. dental school. (Since 2011, graduates of Canadian schools are also allowed to practice here.) These and other protectionist measures inflate the pay of highly educated professionals at great cost to the economy. However, these protectionist barriers never seem to be on the agenda of free traders.
(As many people have pointed out to me, if we simplified the rules so that more foreign professionals could practice in the United States we would get more professionals from developing countries. This could lead to a serious problem of “brain drain” as these countries lose their brightest and most educated people. As I have pointed out many times, we do know how to compensate for this flow of professionals. We could pay the countries from which these people came, so that they would be able to train two or three doctors or other professionals for every one that comes to the U.S. As I have also pointed out, we already get a substantial number of professionals from these countries and provide zero compensation, so it is striking that this concern only arises in the context of a proposal that jeopardizes the pay of high-end professionals.)
It is also important to note that stronger and longer patent and copyright and related protections have been a central part of recent trade deals. These protections are protectionism, the opposite of free trade. They are enormously costly and redistribute income upward. In the case of prescription drugs alone, patent and related protections raise the amount we pay for drugs by around $350 billion annually (@ $2,500 per family, per year) compared with the free market price. Patent monopolies do support research, but there are other more efficient mechanisms for financing research. (Get the full story in my book Rigged: How Globalization and the Rules of the Modern Economy Were Structured to Make the Rich Richer. It’s free.)
Anyhow, it is touching to see that elite types are discovering that much of the country is unhappy with policies that were designed to redistribute from them to elite-types. The question we all must ask is, “are our elites learning?”
Read More Leer más Join the discussion Participa en la discusión
Economists have been disappointed by the extraordinarily weak productivity growth of the last decade. Low productivity growth means that there is less room for improvements in living standards and more leisure.
Fortunately there may be an answer. Timothy Lee at Vox tells us that higher minimum wages are leading to more rapid automation. According to his piece, higher wages are pushing McDonald’s around the country to experiment with touchscreen ordering. This will raise productivity at McDonald’s and at other restaurants that adopt the technology.
While Lee for some reason views higher productivity as a bad thing, virtually all economists view productivity growth as the main determinant of living standards in the long-run. While productivity growth can displace workers, we know how to run macroeconomic policies (e.g. keep the Federal Reserve Board from raising interest rates and/or run larger budget deficits) to maintain full employment. So if Lee is right and higher wages are leading to more rapid productivity growth, this is great news.
Read More Leer más Join the discussion Participa en la discusión
Traditional taxi companies are required to have their drivers undergo extensive background checks, including finger-print based checks. Apparently, Uber lacks the competence to deal with similar requirements to ensure the safety of their passengers. According to the Washington Post the company is prepared to pull out of the state of Maryland if it requires such checks.
It may well be that the Uber management lacks the competence to deal with the safety requirements that traditional taxi companies have adhered to for decades. If this is the case, then hopefully the top management will be replaced by a more competent group. Perhaps they will spend more of their resources managing the company and less on highly paid lobbyists like former Obama adviser David Plouffe.
Read More Leer más Join the discussion Participa en la discusión
Read More Leer más Join the discussion Participa en la discusión
Read More Leer más Join the discussion Participa en la discusión
Steve Rattner had a column on Donald Trump’s deal to keep 1,000 jobs at the Carrier air conditioner factory in Indiana in the country. The column argues against imposing tariff barriers that would protect manufacturing workers, but ignores the protectionist barriers that inflate the wages of doctors and other highly paid professionals.
The United States prohibits foreign doctors, even those with top quality health care systems like Germany and Netherlands, from practicing in the United States unless they complete a U.S. residency program. It also prohibits foreign dentists from practicing in the United States unless they graduate from a U.S. dental school. (Since 2011, graduates of Canadian dental schools have also been allowed to practice here.)
As a result of these and other protectionist measures we pay far more for the services provided by these professionals. In the case of doctors, their average pay of more than $250,000 a year (net of malpractice insurance and other expenses) is twice the average of other wealthy countries. This costs the country close to $100 billion a year (@$700 per household) in higher health care costs.
There are enormous potential gains to the economy from removing the protectionist barriers in these high-end professionals. It would also be a huge step toward reducing inequality. Unfortunately, it seems that people like Rattner and other protectionists who write on trade for the NYT are not willing to consider free trade policies.
Read More Leer más Join the discussion Participa en la discusión
You need not be a fan of Donald Trump to say that trade has had a big impact on manufacturing jobs, you really just need to be someone in the reality-based community. Unfortunately, a lot of people who should, and probably do, know better are insisting that trade is not a big deal. The story is that we lost the jobs due to productivity growth, not trade.
There are three points worth making here. The first is a simple logical one, we have a trade deficit of around $500 billion a year, a bit less than 3.0 percent of GDP. This is basically all due to a deficit in manufactured goods (we have a surplus on services). Does anyone believe that the extra imports associated with the trade deficit are not associated with jobs? Can $500 billion worth of manufactured goods be produced without hiring people? (This matters much more in a context where we face secular stagnation, meaning there is not enough overall demand in the economy.)
The second point is that our trade deficit has not always been this large. Our deficits had been around 1.0 percent of GDP through most of the period from the late 1970s until the East Asian crisis in 1997. Following the crisis, the value of the dollar soared and the trade deficit did also. It eventually peaked at almost 6.0 percent of GDP in 2005–2006. (I should be giving the non-oil deficit, but I’m too lazy to look that up just now.)
Anyhow, this explosion in the trade deficit coincided with a sharp decline in manufacturing employment.
Jobs in Manufacturing
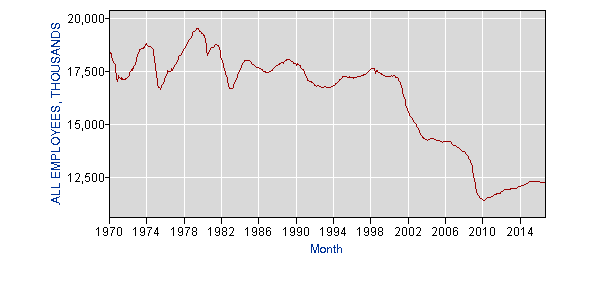
Source: Bureau of Labor Statistics.
As can be seen, manufacturing employment stayed close to 17.5 million from the early 1970s to 2000. We had plenty of productivity growth over these three decades, but little net change in manufacturing employment, in spite of cyclical ups and downs. It was declining as a share of total employment, which almost doubled over this period. Then, as the trade deficit explodes, we see manufacturing employment plummet. Note that most of the drop is before the Great Recession in 2008.
The final point is that much of the gains in productivity in the last two decades are illusory. Susan Houseman points out that the bulk of the reported gains in productivity growth are not in industries like autos and steel, but in the computer sector. So a pickup in productivity growth cannot explain the decline in manufacturing employment in most sectors.
I should also add that even the productivity growth we do see is in part due to the trade deficit. When jobs are lost due to import competition, it is generally going to be jobs in the least productive plants. By eliminating low productivity jobs, average productivity will rise even if no plant has actually increased its productivity.
Anyhow, we should not look to combat Donald Trump by following his tendency to ignore reality. Yes, trade has cost manufacturing workers jobs. We can propose different remedies (mine begin with getting the value of the dollar down against other currencies), but let’s not deny what is true.
You need not be a fan of Donald Trump to say that trade has had a big impact on manufacturing jobs, you really just need to be someone in the reality-based community. Unfortunately, a lot of people who should, and probably do, know better are insisting that trade is not a big deal. The story is that we lost the jobs due to productivity growth, not trade.
There are three points worth making here. The first is a simple logical one, we have a trade deficit of around $500 billion a year, a bit less than 3.0 percent of GDP. This is basically all due to a deficit in manufactured goods (we have a surplus on services). Does anyone believe that the extra imports associated with the trade deficit are not associated with jobs? Can $500 billion worth of manufactured goods be produced without hiring people? (This matters much more in a context where we face secular stagnation, meaning there is not enough overall demand in the economy.)
The second point is that our trade deficit has not always been this large. Our deficits had been around 1.0 percent of GDP through most of the period from the late 1970s until the East Asian crisis in 1997. Following the crisis, the value of the dollar soared and the trade deficit did also. It eventually peaked at almost 6.0 percent of GDP in 2005–2006. (I should be giving the non-oil deficit, but I’m too lazy to look that up just now.)
Anyhow, this explosion in the trade deficit coincided with a sharp decline in manufacturing employment.
Jobs in Manufacturing
Source: Bureau of Labor Statistics.
As can be seen, manufacturing employment stayed close to 17.5 million from the early 1970s to 2000. We had plenty of productivity growth over these three decades, but little net change in manufacturing employment, in spite of cyclical ups and downs. It was declining as a share of total employment, which almost doubled over this period. Then, as the trade deficit explodes, we see manufacturing employment plummet. Note that most of the drop is before the Great Recession in 2008.
The final point is that much of the gains in productivity in the last two decades are illusory. Susan Houseman points out that the bulk of the reported gains in productivity growth are not in industries like autos and steel, but in the computer sector. So a pickup in productivity growth cannot explain the decline in manufacturing employment in most sectors.
I should also add that even the productivity growth we do see is in part due to the trade deficit. When jobs are lost due to import competition, it is generally going to be jobs in the least productive plants. By eliminating low productivity jobs, average productivity will rise even if no plant has actually increased its productivity.
Anyhow, we should not look to combat Donald Trump by following his tendency to ignore reality. Yes, trade has cost manufacturing workers jobs. We can propose different remedies (mine begin with getting the value of the dollar down against other currencies), but let’s not deny what is true.
Read More Leer más Join the discussion Participa en la discusión
The NYT had a major article focused on a Chinese man who makes his living by exposing retailers for selling unauthorized versions of clothes, shoes, and other retail products. His income comes from the government, which rewards people who find unauthorized copies of products being sold in stores. The article repeatedly refers to these items as “counterfeit.” This is inaccurate.
While all the items noted in the piece are in principle being sold without the consent of the named manufacturer, many would not qualify as “counterfeits.” The difference is that in many cases, the buyer knows that they are not getting a product made by the named manufacturer. They are willing to buy the product anyhow because it comes with a substantial discount. In this case, the product is not actually a counterfeit, since the consumer knows what they are buying.
This is not just a semantic point. If the consumer is being deceived, they are an ally in cracking down on the practice. On the other hand, if consumers willingly buys a product, knowing that it is not actually the named brand, then they will resist efforts to crack down.
Clearly China’s law in this area is designed to crack down on both actual counterfeits, in some cases raising serious safety issues, and also unauthorized copies that allow consumers to buy products at large discounts. It would have been helpful to be clear on this distinction so that readers would have a better idea of what is at stake.
Read More Leer más Join the discussion Participa en la discusión
This is an important point that would have been worth including in this NYT article on the growing risks in the subprime car loan market. The lack of oversight from the Consumer Financial Protection Bureau (CFPB) is likely a major reason that bad lending practices persist in this area.
Note: I corrected the title to make it more accurate. The loans themselves are covered by the CFPB, the arrangements and discussions by dealers explaining the terms of the loan are not. Thanks to Robert Salzberg for calling this to my attention.
Read More Leer más Join the discussion Participa en la discusión
He may not have intended to say that Trump voters were driven by illusions, but that is effectively what he wrote. His column warned Democrats that they have to move right to get more political support:
“…some of the Trumpian (and pre-Trumpian) backlash against liberalism in white working-class communities was associated with welfare programs — disability rolls, food stamps, Medicaid — that seem to effectively underwrite worklessness at a time of social disarray. It would not require Democrats abandoning their commitment to the social safety net to foreground programs more directly linked to work and independence, and to acknowledge the problems of dependence and stagnation associated with no-strings-attached support.”
Of course, fans of reality know that the number of people getting disability benefits has fallen somewhat as the economy recovered from the downturn. The combined number of people getting workers compensation or disability has actually been falling since 2000. So if Trump voters are upset about people using disability related programs to avoid working, they have less to complain about under the liberal Obama administration than under President Bush.
There has been an increase in the number of people getting food stamps under President Obama, but it seems unlikely that benefits averaging $125 a month per person are keeping too many people out of work. The same story applies to the Medicaid expansion.
As a practical matter, if the concern is about prime-age workers (ages 25 to 54) not working, then Trump voters should have been angry at the Bush conservatives, not President Obama. The employment-to-population ratio for prime-age workers fell by 4.4 percentage points while President Bush was in the White House. It has risen by 1.2 percentage points since President Obama took office.
So it seems that Trump voters are angry about something that does not exist in the world. Apparently, they have been misinformed by their news sources, including people like Douthat.
Read More Leer más Join the discussion Participa en la discusión


