


Donald Trump is about to become president and immediately begin violating the constitution. The constitution explicitly prohibits the president from taking payments and gifts from foreign governments. (Can we stop using the term “emolument”? No one has used it for a hundred years. We want to be clear on what the constitution means.)
Donald Trump is right now and will continue to be taking payments and gifts from foreign governments in the form of benefits to his properties, unless he dumps the stuff. This is about as clear a violation of the constitutional provision imaginable, so why on earth do we have Andrew Ross Sorkin approvingly accepting Donald Trump’s nonsense claim in his letter to Mr. Trump:
“You understand the conundrum. ‘In theory, I don’t have to do anything’ to distance yourself from your business holdings, you told journalists at The New York Times last week, ‘but I would like to do something — I would like to try and formalize something.'”
This is wrong. Trump absolutely does have to do something. It’s not a question of his being a nice guy. This is a constitutional provision. The constitution sets the rules on who can be president and how they conduct themselves. Just as it says the president must be at least 35 years old and must be a native born citizen, it also says the president can’t take payments from foreign governments.
Perhaps even more incredible than Sorkin’s misrepresentation of the constitution, his plan is just a bad joke.
“Voluntarily agree to hire what is known as a ‘corporate monitor,’ an independent overseer with unfettered access to your organizations who will provide regular reports to the public about any possible instances of conflicts.”
Okay, let’s get this one straight. Donald Trump can’t keep himself from tweeting out loony claims about massive vote fraud in the middle of the night. He routinely makes personal attacks on his critics without any evidence. This guy is going to defer to a “corporate monitor” in his actions as president.
So when President Erdogan in Turkey gives favorable treatment to Trump’s golf courses there, is the corporate monitor going to be able to know if this affects Donald Trump’s decision to look the other way as he locks up all his political opponents? If Scotland decides to ban the wind turbines near his resort, will the corporate monitor know if this affects his attitude towards Scottish independence? And, as a practical matter, do we really believe that Trump would be constantly checking in with his corporate monitor anyhow?
Sorkin’s proposal is a complete joke. If we give a damn about the constitution, Donald Trump has to sell off his empire and place his assets in a blind trust, just like every other president has done for the last half century. (I explain how he could do this here.) If he chooses not to do this, then Trump is constitutionally unable to be president, just as if he was born in Kenya. It’s that simple.
Read More Leer más Join the discussion Participa en la discusión
Hey, why should he be left out? He repeats the story about prime age (ages 25–54) men dropping out of the workforce. As noted here before, since 2000 there has been a comparable drop in employment rates for prime-age women. It is important to add in this respect that employment rates for women had been rising before 2000 and were almost universally expected to continue to rise. In other words, there is a simple story where the drop in both men and women’s employment rates is due to a weak labor market, but hey that’s too easy, let’s see if we can blame the workers rather than the folks who make economic policy.
The other point where Samuelson is misleading is in citing the claim that government benefits, like disability payments, are a possible reason that men have been dropping out. While he notes that the Council of Economic Advisers (CEA) argued against this by noting that these benefits had not risen rapidly enough to explain the increase in the drop out rate, it also would have been worth noting the rest of the argument. The CEA also pointed out that the United States ranks near the bottom of OECD countries in the generosity of its benefits, but it also ranks near the bottom in labor force participation rates for prime-age workers. In other words, that doesn’t sound like a very plausible explanation.
Read More Leer más Join the discussion Participa en la discusión
The NYT had an interesting piece on the hopes that West Virginians placed on the ability of Donald Trump to bring back jobs to the state. However, a comment on the loss of mining jobs under President Obama may have misled readers.
The piece noted:
“Coal has always been boom and bust; its decline began long before Mr. Obama took office. But in West Virginia alone, 12,000 coal industry jobs have been lost during his tenure.”
While this is true, the start of the Obama administration was a temporary peak for the coal industry, as the sharp run-up in oil prices in the prior four years had substantially increased the demand for coal as shown in the figure below.
Coal Mining Jobs in West Virginia
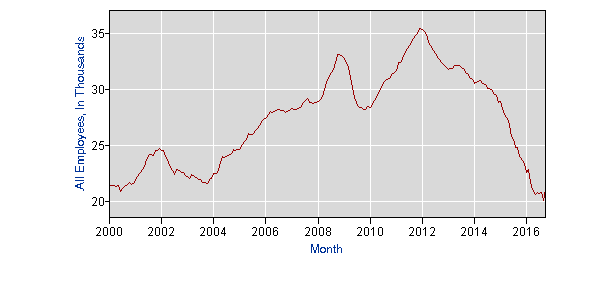
Source: Bureau of Labor Statistics.
While there was a substantial loss of coal mining jobs during the Obama years, mostly due to the availability of low cost natural gas, the most recent employment levels are almost the same as they were in 2000.
The NYT had an interesting piece on the hopes that West Virginians placed on the ability of Donald Trump to bring back jobs to the state. However, a comment on the loss of mining jobs under President Obama may have misled readers.
The piece noted:
“Coal has always been boom and bust; its decline began long before Mr. Obama took office. But in West Virginia alone, 12,000 coal industry jobs have been lost during his tenure.”
While this is true, the start of the Obama administration was a temporary peak for the coal industry, as the sharp run-up in oil prices in the prior four years had substantially increased the demand for coal as shown in the figure below.
Coal Mining Jobs in West Virginia
Source: Bureau of Labor Statistics.
While there was a substantial loss of coal mining jobs during the Obama years, mostly due to the availability of low cost natural gas, the most recent employment levels are almost the same as they were in 2000.
Read More Leer más Join the discussion Participa en la discusión
Read More Leer más Join the discussion Participa en la discusión
In spite of all the stories about robots taking all the jobs, we still can’t find any evidence in the productivity data. Productivity has averaged just 0.6 percent annually over the last six years, the slowest growth on record.
But now the Wall Street Journal alerts us to a new problem. It tells us that small businesses can’t find enough workers in low-skilled occupations. If that sounds to you like the direct opposite of the job-killing robots story, then you’re way ahead of many of the pundits who get paid big bucks to say smart things about the economy.
If the Wall Street Journal piece is right, then the jobs-killing robots story is wrong. Our economy is continuing to create large numbers of jobs for people with relatively few skills.
Of course, the labor shortage story is also more than a bit misleading. Capitalism prescribes a simple remedy for addressing labor shortages. It’s called higher wages. The piece does assure us that higher wages is not the problem, but some arithmetic would be helpful here.
In one case it mentions a roofer who is now paying most of his workers over $20 an hour. While this is a better wage than most workers receive, roofing is a physically demanding and dangerous job. If the minimum wage had kept pace with productivity growth since the late 1960s (as it had in the prior three decades), it would be almost $19 an hour today, so crossing $20 an hour hardly seems like especially high pay in 2016. (It’s equal to 0.008 percent of what Goldman Sachs pays its speakers.)
The other area where we are told there are shortages is farmworkers. Here the pay is $11 an hour, but we assured that this is not the problem, the problem is that workers who are U.S. citizens want to be paid in cash so they don’t have to pay taxes.
It’s certainly possible that many of the business owners who are complaining about a labor shortage would not be able to stay in business if they offered higher wages. But this is the way a market economy works. Businesses that can’t afford to pay the prevailing wage go out of business and their workers go into areas where their labor can be more productively employed. This process is the reason that half of the country is no longer working in agriculture.
In short, the story of the job-killing robots seems like a myth that helps to employ highly educated people, while the problem of the labor shortage is one of business owners who don’t understand how a market economy works.
Read More Leer más Join the discussion Participa en la discusión
Suppose a candidate proposed ending the U.S. commitment to NATO. Based on this NYT article on Republican plans to privatize Medicare, the headline would probably tell readers that the candidate wanted to “change” U.S. involvement with NATO.
In fact, as readers of the article will discover, Republicans want to replace Medicare’s commitment to provide seniors with insurance that covers most of their health care costs with a “a fixed government contribution for each beneficiary.” After describing the system in this manner — virtually the textbook definition of “voucher,” the article then told readers:
“For nearly six years, Speaker Paul D. Ryan has championed the new approach, denounced by Democrats as ‘voucherizing’ Medicare.”
The use of quotation marks in this sentence is difficult to understand, since there seems little dispute that Speaker Ryan does in fact want to replace Medicare with a voucher, as this article had just explained. What is up for debate is whether it is desirable to replace Medicare with a voucher system, not whether the Republicans want to do it.
Read More Leer más Join the discussion Participa en la discusión
When the initiative to take the United Kingdom out of the European Union was being debated, many people, including many economists, predicted the country would be hit with a severe recession. It didn’t happen. The economy seems to be moving along fine, with no recession in sight, although the London real estate market is not looking very good. Of course the UK has not left the European Union yet, or even developed a plan to do so, but it is unlikely that many would want to place much money on that recession bet today.
Apparently, the conservative government has now abandoned its plans for further austerity and a balanced budget. It is expected to spend an additional $187 billion over the next five years (roughly 1.0 percent of GDP) to boost the economy and create jobs. According to the NYT, this spending is a direct response to concerns over the plight of working class people who voted for Brexit in large numbers.
This outcome is worth noting, because the boost to the economy from additional spending is likely to be larger than any drag on growth as a result of leaving the European Union. This would mean that the net effect of Brexit on growth would be positive. Of course the UK government could have abandoned its austerity path without Brexit, but probably would not have done so. Given the political context, working class voters who wanted to see more jobs and a stronger welfare state likely made the right vote by supporting Brexit. This doesn’t excuse the racist sentiments that motivated many Brexit supporters, but it is important to recognize the economic story here.
There is a deeper lesson in this story. The elites that derided Brexit were largely content with austerity policies that needlessly kept workers from getting jobs and also weakened the welfare state. Many were willing to push nonsense economic projections of recession in order to advance their political agenda. In this context, it is not surprising that large numbers of working class people would reject their argument that Brexit would be bad for the UK.
We see a similar situation in the United States where trade policies that are designed to redistribute income upward, like the Trans-Pacific Partnership, are foisted on the public by the leadership of both parties. As with Brexit, elite economists are prepared to make absurd predictions of economic disaster if this trade agenda is rejected. Under these circumstances, it is not surprising that large portions of the working class are not willing to go along with the elite’s agenda.
Read More Leer más Join the discussion Participa en la discusión
The world would be a much better place if the folks who wrote on economic issues at the NYT had at least an intro econ level understanding of economics. But apparently that is too much to expect, so we find Thomas Friedman telling readers:
“The one area where I think Trump is going to have the hardest time delivering on his campaign promises is to create ‘millions’ of good-paying jobs by incentivizing and pressuring American companies to manufacture more in the U.S. He still talks about America as a manufacturing wasteland when, in fact, manufacturing remains the largest sector of the U.S. economy but employs far fewer workers.
“As the management consultant Warren Bennis famously observed: ‘The factory of the future will have only two employees, a man and a dog. The man will be there to feed the dog. The dog will be there to keep the man from touching the equipment.'”
While Trump will not be able to bring back the six million manufacturing jobs we have lost in the last two decades, it is certainly possible that he could bring back 1–2 million manufacturing jobs if he were to get the trade deficit closer to balance. That would be a big deal for lots of workers, especially if the workers who held these jobs were able to form unions to ensure decent wages and benefits.
In terms of the factory of the future, it may well be highly automated, but that is not the factories of today, which still employ more than 12 million workers. Contrary to what Friedman types continually tell people, the automation process is actually moving very slowly as productivity growth in manufacturing and the rest of the economy has slowed to a crawl.
Productivity in Manufacturing
 Source: Bureau of Labor Statistics.
As the chart shows, productivity growth in manufacturing has averaged less than 0.5 percent annually over the last five years. The factory of the future may only have a person and a dog, as in Friedman’s story, just as the newspaper of the future may have only a computer program to write columns, but we are not at this future yet and not likely to be there soon.
The world would be a much better place if the folks who wrote on economic issues at the NYT had at least an intro econ level understanding of economics. But apparently that is too much to expect, so we find Thomas Friedman telling readers:
“The one area where I think Trump is going to have the hardest time delivering on his campaign promises is to create ‘millions’ of good-paying jobs by incentivizing and pressuring American companies to manufacture more in the U.S. He still talks about America as a manufacturing wasteland when, in fact, manufacturing remains the largest sector of the U.S. economy but employs far fewer workers.
“As the management consultant Warren Bennis famously observed: ‘The factory of the future will have only two employees, a man and a dog. The man will be there to feed the dog. The dog will be there to keep the man from touching the equipment.'”
While Trump will not be able to bring back the six million manufacturing jobs we have lost in the last two decades, it is certainly possible that he could bring back 1–2 million manufacturing jobs if he were to get the trade deficit closer to balance. That would be a big deal for lots of workers, especially if the workers who held these jobs were able to form unions to ensure decent wages and benefits.
In terms of the factory of the future, it may well be highly automated, but that is not the factories of today, which still employ more than 12 million workers. Contrary to what Friedman types continually tell people, the automation process is actually moving very slowly as productivity growth in manufacturing and the rest of the economy has slowed to a crawl.
Productivity in Manufacturing
Source: Bureau of Labor Statistics.
As the chart shows, productivity growth in manufacturing has averaged less than 0.5 percent annually over the last five years. The factory of the future may only have a person and a dog, as in Friedman’s story, just as the newspaper of the future may have only a computer program to write columns, but we are not at this future yet and not likely to be there soon.
Read More Leer más Join the discussion Participa en la discusión
Read More Leer más Join the discussion Participa en la discusión
The Republicans, including Donald Trump, have repeatedly complained that provisions of Dodd-Frank have cut off small business access to credit. David Greene picked up the charge in an interview with Barney Frank on Morning Edition. He repeatedly asked Frank if the Republican complaints about the law were correct.
While Frank responded by challenging Greene to name the provisions that were responsible for cutting off credit, there actually is a simpler response. Credit to small businesses has not been cut off, or at least if it has, small businesses don’t seem to have noticed. The monthly survey of small businesses conducted by the National Federation of Independent Business shows that they feel credit has almost never been more easily available.
In other words, the Republicans have made up a nonsense claim about the economy, and Greene has chosen to re-enforce rather than checking its validity.
Read More Leer más Join the discussion Participa en la discusión


