


Read More Leer más Join the discussion Participa en la discusión
A Washington Post article on the June employment report yesterday noted the jump in involuntary part-time employment:
“In June, their ranks [the number of people who are working part-time but want full-time jobs] swelled by 275,000 to 7.5 million. In 2007, 4.4 million people fell into this category.”
It is important to note the longer term trend here since the month to month movements are highly erratic. The number of people working part-time involuntarily is down by 640,000 from its year ago level and by more than 1.6 million from its peak in 2010.
There are more people voluntarily working part-time, but this is a positive. (These are workers who answer a survey by saying they have chosen to work part-time, less than 35 hours a week.) The number of people voluntarily working part-time typically rises in an upturn, presumably because workers feel they have more choice about jobs and many people would rather work fewer hours to take care of children or other family members or possibly because their own health makes full-time employment difficult. The Affordable Care Act has likely increased the number of people who are working part-time voluntarily since many workers will no longer feel the need to work at a job that provides health care insurance since they can buy it through the exchanges.
Read More Leer más Join the discussion Participa en la discusión
It is amazing that a lengthy piece in the NYT discussing the high cost of new vaccines and the efforts of companies to promote them never discussed the possibility of alternatives to patent monopolies as a way to finance the research. Until recent years, most vaccines actually were developed with public funding, so obviously it is possible.
If the research were paid with public funding, then vaccines would be cheap since they would all be generics. And, there would not be a problem with companies misrepresenting their safety and effectiveness. Monopoly profits give companies an incentive to lie, a fact that economists generally recognize in other circumstances.
The impact of misleading promotion campaigns is especially important in the case of vaccines. Many vaccines are required for allowing children into school. In other words, the government will arrest parents who don’t pay companies their monopoly profits on these vaccines. And in the loon tune land of modern economics, this is called a free market outcome.
Read More Leer más Join the discussion Participa en la discusión
It is painful to read Eduardo Porter’s column on the prospects for slowing global warming and China’s greenhouse gas emissions. It’s not that Porter got anything in particular wrong; he is presenting standard projections that are the basis for international negotiations. Rather it is the framing of the trade-offs that is painful.
Porter poses the question of the extent to which China should be willing to slow its economic growth to curb its greenhouse gas emissions, as opposed to rich countries like the United States bearing more of the burden. The reason this is painful is that most folks might recall that our major economic problem at the moment is secular stagnation.
In case people forgot, this is a problem of inadequate demand. The story is that we don’t have enough demand for goods and services to keep our workforce fully employed. As a result we have tens of millions who are unemployed, underemployed, or who have given up looking for work altogether. This is not just a U.S. problem but one that afflicts much of the world.
Okay, now bring in the problem of global warming. Isn’t it horrible that we face this immense environmental problem at the same time that our economies are suffering from this horrible problem of secular stagnation? Arghhhhhh!
The problem of global warming is one that needs lot of work. We need people to retrofit our buildings to make them more energy efficient, to put up solar panels and wind turbines to get clean energy. How about paying people to drive free buses so that commuters have more incentive to leave their cars at home? We need to build smart grids to minimize energy wastage. The list is really long.
This issue comes up very directly in terms of our economic relations with China. Our big complaint (at least publicly) is that China is deliberately keeping down the value of its currency against the dollar in order to export more to the United States. That’s a too little demand story again. But, we also want them to spend more on curbing greenhouse gas emissions. That’s a perfect way to address the too little demand story.
Instead of subsidizing its exports to the United States (the effect of China’s present trade policy), China could redirect these resources to subsidizing its installation of solar panels. Everyone stays fully employed and we get fewer greenhouse gas emissions.
These transitions are not all simple and easy, but the basic point is that two problems fit together perfectly. The enormous spending associated with World War II was the cure for our last depression. No one in their right mind would want to see another catastrophic war, but a massive deployment of resources to curb greenhouse gas emissions worldwide would serve the same purpose.
Come on folks, this really isn’t hard.
Read More Leer más Join the discussion Participa en la discusión
It seems that Matthew D’Ancona is upset that people are criticizing former Prime Minister Tony Blair, who is apparently making vast sums in a second career in the financial industry and on the speaking circuit. There are several points worth noting.
First, as is the case with Bill Clinton, his generational counterpart in the United States, the public certainly has good cause to be upset that Blair set the economy on a path of bubble driven growth, even if the bubble blew on the watch of his successor. The public also has the right to be furious that Blair, like President Bush in the United States, misled his country into war in Iraq.
Both of these factors should be enough to tarnish Blair’s public standing well past his lifetime, but the immediate topic is the fortune that he is amassing in his career as a former Prime Minister. There are two issues here. First, it is difficult to avoid the perception that Blair, like Clinton and now former Treasury Secretary Timothy Geithner, are cashing in on the connections that they have made in their political careers. It seems more plausible that Blair and Geithner are attractive as employees in the financial industry because of who they know, as opposed to their business acumen. Also, the lavish speaking fees these people earn can be at least as much to curry favor as opposed to an immense desire to hear their wisdom.
But let’s give Blair and Co. the benefit of the doubt and assume that there are no quid pro quos for the hundreds of millions being thrown their way. There is still a separate issue. Suppose that Tony Blair had spent his political career sounding more like Elizabeth Warren than Bill Clinton. Would the big bucks still be flowing in his direction?
My guess is that the answer is no. Blair, like Clinton and Geithner, is eligible to get incredibly wealthy in his second career because he has pursued policies that were hugely favorable to the financial industry. This is a serious problem.
If we give our political leaders credit for a tiny bit of foresight, they would recognize that they stand to become enormously wealthy if they pursue policies favorable to the financial sector and other big business interests. On the other hand, if they pursue more balanced policies they will just enjoy the retirement of a very well paid professional. D’Ancona wants us to believe that this fact could not possibly affect the policies they pursue while in office, and he is angry at those who might think otherwise.
Read More Leer más Join the discussion Participa en la discusión
The NYT had an article about a plan to allow some workers in Germany to retire early and collect full benefits from their version of Social Security. According to the article, workers who have paid into the system for 45 years will be able to start collecting full benefits at age 63 instead of the standard age of 65. (This is being raised to 67, as is the case in the United States.)
While the piece provides interesting background about the economic and political context for this decision, it gives no context for the numbers in the piece, which will therefore be meaningless to the overwhelming majority of NYT readers. For example, it tells readers that 6,000 workers have already applied for early benefits and that 200,000 are projected to be eligible. It is unlikely that many readers have a good sense of how large these numbers are relative to Germany’s workforce. (According to the OECD, employment in Germany is roughly 40 million. This means that the 6,000 current applicants amount to 0.015 percent of total employment. If all 200,000 eligible workers took advantage of early retirement it would be equal to 0.5 percent of total employment.)
The piece later tells readers:
“The costs of the early retirement, estimated to grow over the next decade to €3 billion from about €1 billion, or to $4.1 billion from $1.4 billion.”
It is unlikely that many readers have much sense of how important 1 billion euros is to Germany’s budget today or how important 3 billion euros will be a decade from now. Germany’s current budget is roughly 1.3 trillion euros, which means that the cost of early retirement is roughly 0.08 percent of current spending. The projected 3 billion euro cost would be roughly 0.18 percent of projected spending.
It should have been a simple matter for the paper to put these numbers in a context that would make them understandable to readers, instead of just putting in numbers that will be almost meaningless to everyone who reads them. The paper’s Public Editor Margaret Sullivan made this point herself last fall and apparently got agreement from the NYT editors. Yet, for some reason practices seem not to have changed.
This is getting almost like the Twilight Zone. We have a journalistic practice that everyone agrees is wrong, that is easy to change, but nonetheless persists. What is going on here?
Note: this piece was corrected to say “full benefits.” Thanks DC Analyst.
Read More Leer más Join the discussion Participa en la discusión
Neil Irwin has a piece noting housing’s importance in the downturn, which gets things half right. First, housing is typically important in economic cycles, as he says, but the picture is quite different than Irwin implies.
In a typical recession housing construction falls because it is very sensitive to interest rates. Most recessions are brought on by the Fed raising interest rates to slow the economy. In these cases the decline in housing is a deliberate outcome of Fed policy, not an accidental outcome to be avoided.
In contrast, the most recent downturn was brought on by a collapse of a housing bubble. This made it qualitatively different from most prior downturns (the 2001 recession was also bubble induced) in several different ways.
First, construction was proceeding at an extraordinary rate of more than 6.0 percent of GDP before the collapse, compared to an average rate of just over 4.0 percent of GDP. This meant that housing contracted far more than it would in a typical downturn. Furthermore, because of the overbuilding of the bubble years, housing fell further than normal, hitting levels just above 2.0 percent of GDP. And, because the downturn was not brought on by a rise of interest rates it could not be reversed by a drop in interest rates.
There really should not have been much mystery about housing being in a bubble. There was a huge unprecedented run-up in house prices that broke with a century long trend in which nationwide house prices had just kept pace with the overall rate of inflation. There was no plausible basis in the fundamentals of the housing market for this run-up, with income and population growth both relatively weak. And, rent just kept pace with inflation during the bubble years.
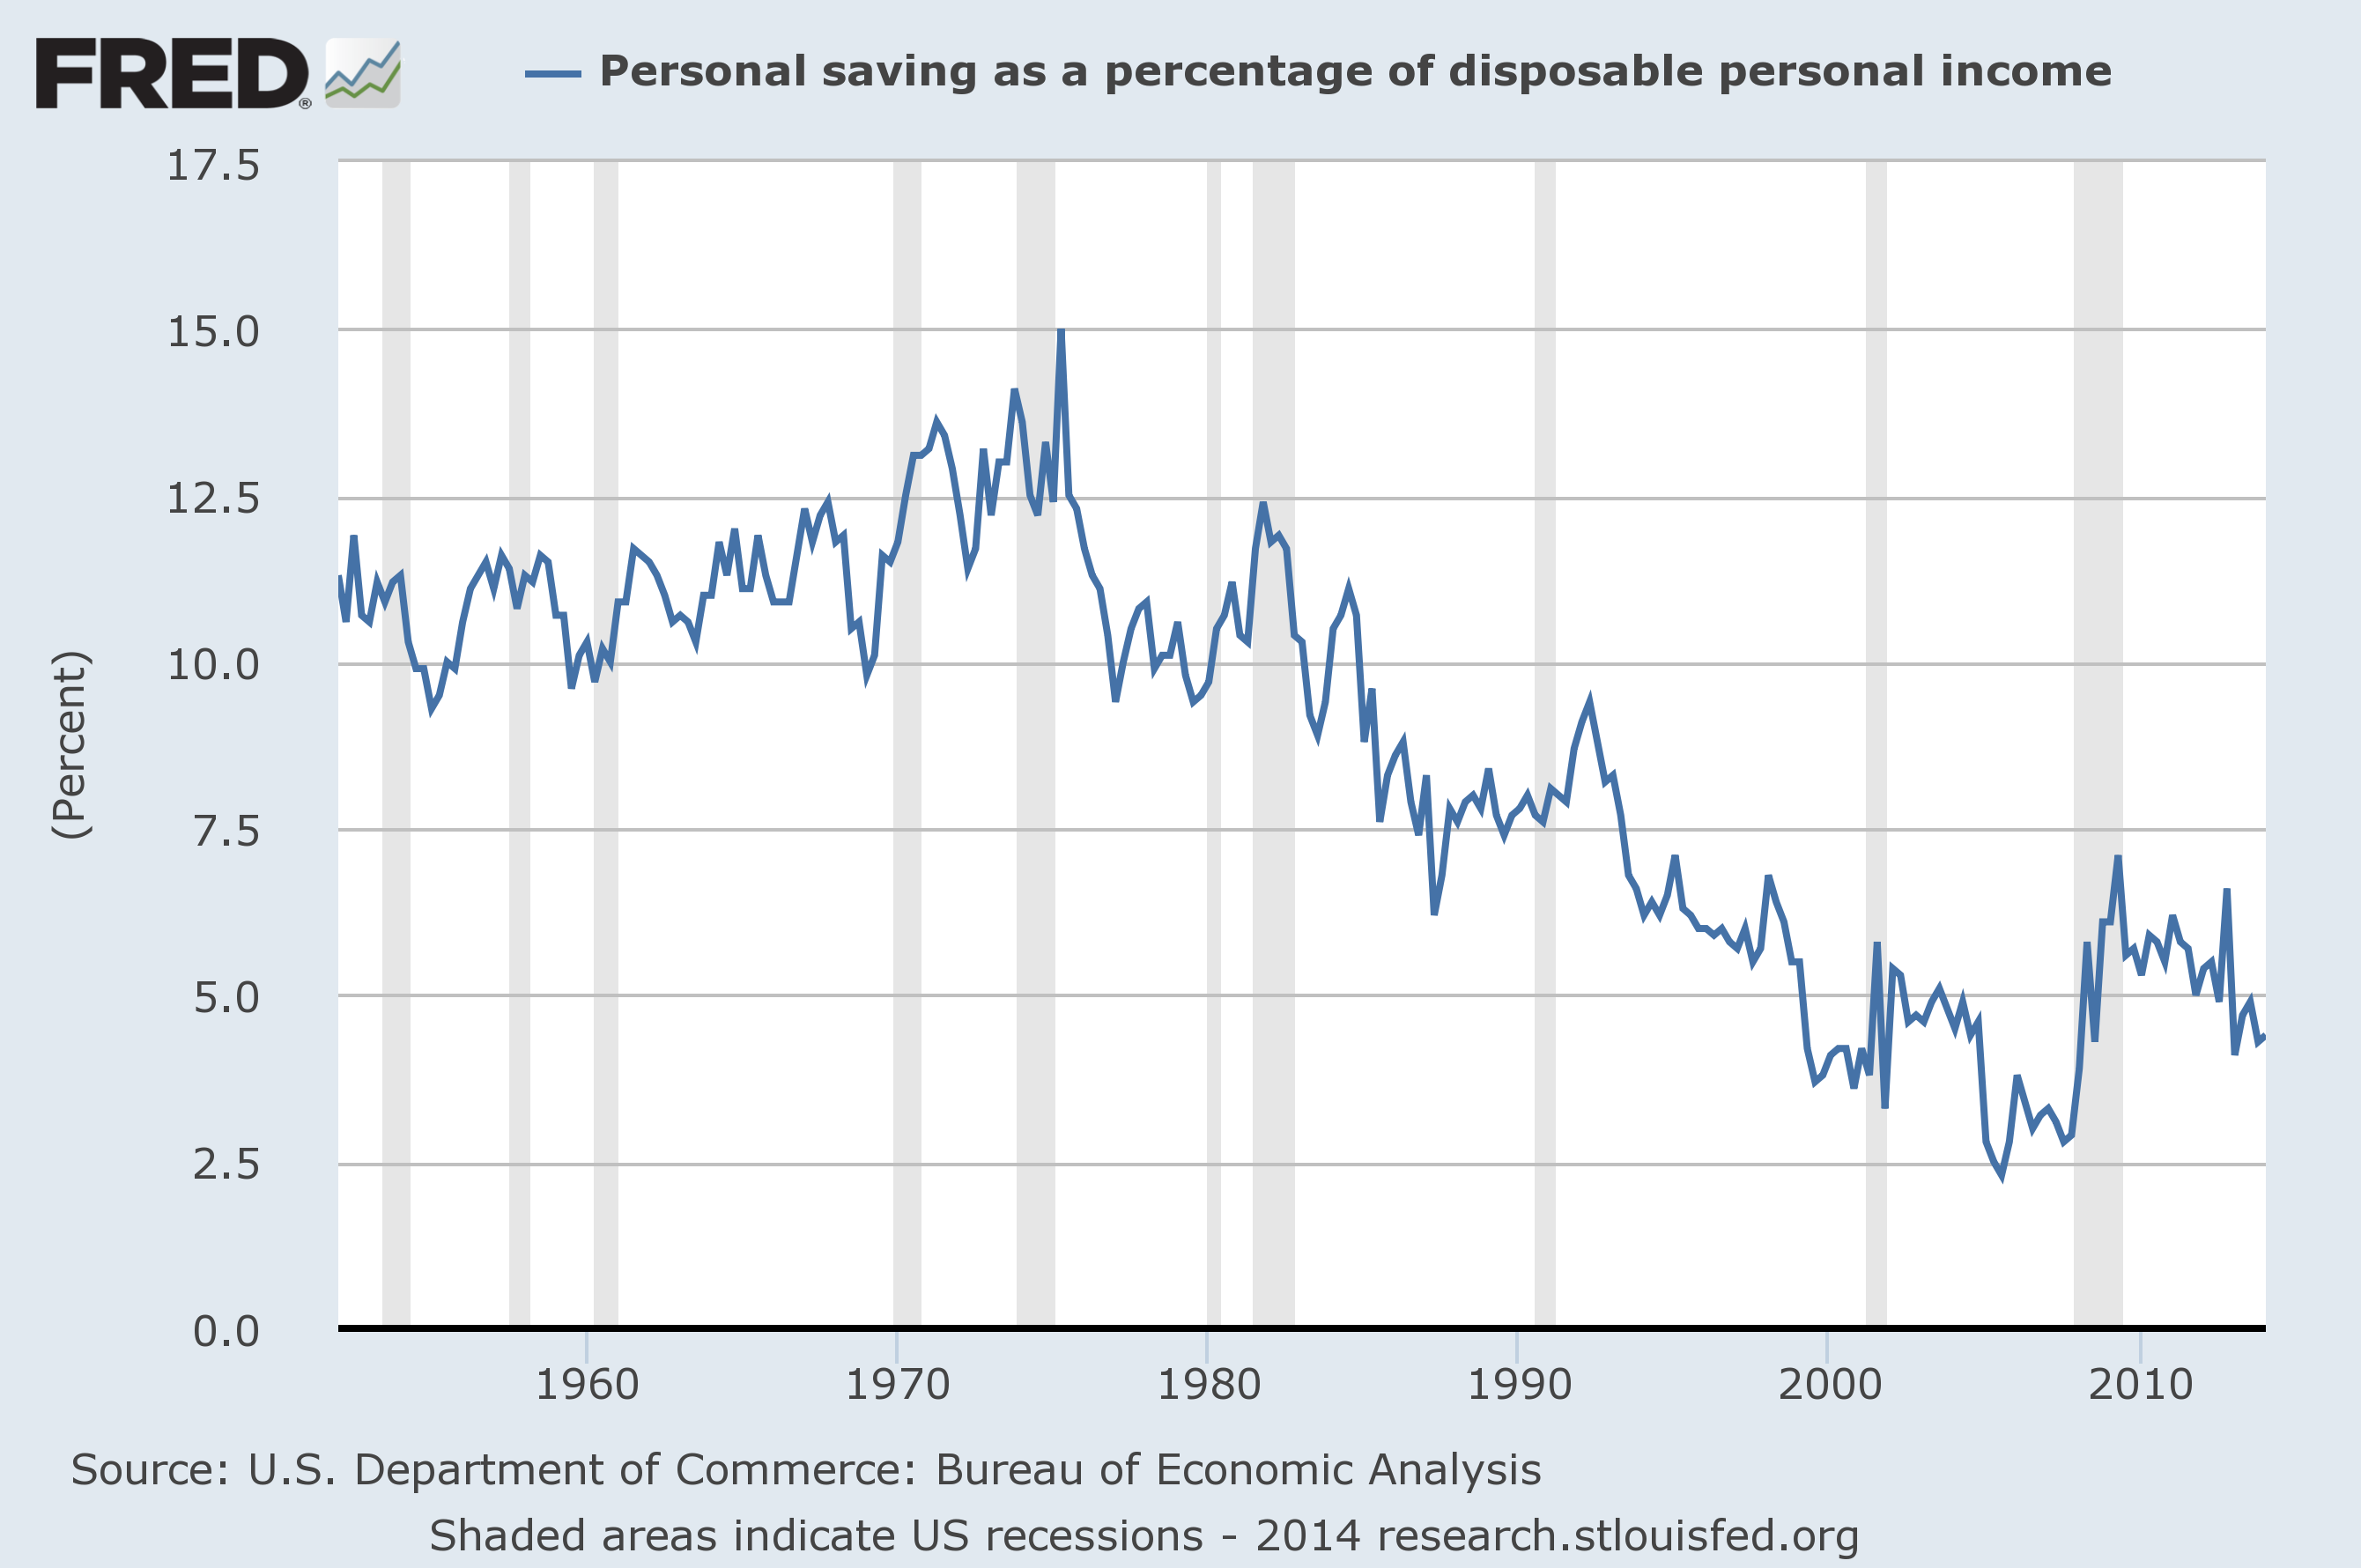
The effect of the bubble on consumption was also predictable. The bubble created trillions of dollars of ephemeral housing wealth. This led to a surge in consumption due to the housing wealth effect, pushing the savings rate to record lows. When the bubble burst, consumption fell as the housing wealth disappeared, but the saving rate is in fact still relatively low, contrary to what is often asserted in the media. There is no reason that we should expect people to be consuming a larger share of their income than is currently the case. The only mystery about the current state of the economy is why anyone would see any mystery
Neil Irwin has a piece noting housing’s importance in the downturn, which gets things half right. First, housing is typically important in economic cycles, as he says, but the picture is quite different than Irwin implies.
In a typical recession housing construction falls because it is very sensitive to interest rates. Most recessions are brought on by the Fed raising interest rates to slow the economy. In these cases the decline in housing is a deliberate outcome of Fed policy, not an accidental outcome to be avoided.
In contrast, the most recent downturn was brought on by a collapse of a housing bubble. This made it qualitatively different from most prior downturns (the 2001 recession was also bubble induced) in several different ways.
First, construction was proceeding at an extraordinary rate of more than 6.0 percent of GDP before the collapse, compared to an average rate of just over 4.0 percent of GDP. This meant that housing contracted far more than it would in a typical downturn. Furthermore, because of the overbuilding of the bubble years, housing fell further than normal, hitting levels just above 2.0 percent of GDP. And, because the downturn was not brought on by a rise of interest rates it could not be reversed by a drop in interest rates.
There really should not have been much mystery about housing being in a bubble. There was a huge unprecedented run-up in house prices that broke with a century long trend in which nationwide house prices had just kept pace with the overall rate of inflation. There was no plausible basis in the fundamentals of the housing market for this run-up, with income and population growth both relatively weak. And, rent just kept pace with inflation during the bubble years.
The effect of the bubble on consumption was also predictable. The bubble created trillions of dollars of ephemeral housing wealth. This led to a surge in consumption due to the housing wealth effect, pushing the savings rate to record lows. When the bubble burst, consumption fell as the housing wealth disappeared, but the saving rate is in fact still relatively low, contrary to what is often asserted in the media. There is no reason that we should expect people to be consuming a larger share of their income than is currently the case. The only mystery about the current state of the economy is why anyone would see any mystery
Read More Leer más Join the discussion Participa en la discusión
Quarterly GDP data are erratic and profit data in particular are subject to large revisions, but hey it’s still worth noting a big drop in profit shares reported for the first quarter of 2014. The data released by the Commerce Department last week showed the profit share falling from just over 21 percent of net value added in the corporate sector in the last quarter of 2013 to less than 19 percent in the first quarter of 2014. Here’s the picture.

It’s too early to make much of this drop in profit shares. It is also a bit disconcerting that it is all attributable to a drop in the capital consumption adjustment, the difference between accounting depreciation and economic depreciation as measured by the Commerce Department. (In other words, the Commerce Department is showing a larger gap between what firms record for accounting purposes and the actual rate of depreciation of capital.)
Anyhow, with all the appropriate caveats, this may be the first sign that the sharp rise in profit shares in this century is being reversed, or as Gerald Ford once said, our long national nightmare is over.
Quarterly GDP data are erratic and profit data in particular are subject to large revisions, but hey it’s still worth noting a big drop in profit shares reported for the first quarter of 2014. The data released by the Commerce Department last week showed the profit share falling from just over 21 percent of net value added in the corporate sector in the last quarter of 2013 to less than 19 percent in the first quarter of 2014. Here’s the picture.
It’s too early to make much of this drop in profit shares. It is also a bit disconcerting that it is all attributable to a drop in the capital consumption adjustment, the difference between accounting depreciation and economic depreciation as measured by the Commerce Department. (In other words, the Commerce Department is showing a larger gap between what firms record for accounting purposes and the actual rate of depreciation of capital.)
Anyhow, with all the appropriate caveats, this may be the first sign that the sharp rise in profit shares in this century is being reversed, or as Gerald Ford once said, our long national nightmare is over.
Read More Leer más Join the discussion Participa en la discusión
Read More Leer más Join the discussion Participa en la discusión
The Washington Post did an assessment of which states had the largest share of their eligible population enroll in the exchanges and which states were least successful. California topped the charts with 42 percent of the eligible population followed by Vermont. Picking up the rear was Hawaii, where it tells us less than 15 percent of the eligible population enrolled.
There is a big problem with the Post’s scorecard. The states didn’t start in the same place. In last place Hawaii only 8 percent of its population was uninsured. By contrast, in California 19 percent of its population was uninsured. This means that even with the differences in ACA enrollment Hawaii likely still have a higher insurance rate than California.
While the piece notes Hawaii’s problems in setting up its exchange, it is also the case that as the share of the population who is uninsured gets lower, it becomes more difficult to enroll the people who remain uninsured. These people are likely resistant to signing up for insurance or have difficulties navigating bureaucracies. Therefore it should not be surprising that Hawaii did not do well on this measure.
The piece also highlights enrollments of people 18-32. While there had been much hype around enrolling “young invincibles,” as Kaiser has shown the difference in premiums largely reflects the differences in health care costs. It really doesn’t matter much for the finances of the program how many young people enroll, although it is good to see them getting insurance.
Read More Leer más Join the discussion Participa en la discusión


