


In an article reporting on a speech by Federal Reserve Board Chair Janet Yellen, the Post told readers:
“One of the puzzles currently confounding economists is why inflation has remained so low even as the recovery has picked up steam. The Fed set a 2 percent inflation target but its preferred measure of price changes shows inflation is about half that.”
Actually economists are not at all confounded by why inflation has remained low. The predominant view of inflation is that the change in the rate of inflation depends on the level of unemployment. Since nearly all economists believe the unemployment rate is still above its trend level, they expect inflation to be falling, not rising. In fact the bigger mystery from the standpoint of standard economic models is why the rate of inflation has not fallen more. (The answer is that wages and prices tend to be sticky going downward.)
Anyhow, the confounding is only at the Washington Post. The low inflation rate is not something economists have trouble explaining.
Read More Leer más Join the discussion Participa en la discusión
The Huffington Post really deserves to be called on the carpet for this piece. It implies there is a debate going on between Paul Krugman and Joe Scarborough over whether the Obama administration is tampering with Census data to make the Affordable Care Act look good.
There is no debate because Scarborough has no clue what he is taking about. He knows nothing about how the Census Bureau collects data and what is involved in changing questions as it is now doing. He is literally making a completely baseless accusation. He doesn’t even pretend to have a shred of evidence to support his claim that the Obama administration is tampering with the data.
If he knew anything about the way Census worked, he would know it would be incredibly difficult for the Obama administration to alter its processes. There would almost certainly be people willing to talk if this were the case. Furthermore, any competent analyst would be able to recognize doctored data using other data sets.
Anyhow, Scarborough is not taking part in a debate, he is name calling. This is like someone running out on the baseball field and yelling at the stupid players because it would be much quicker to go from second base to home by running over the pitcher’s mound. If Scarborough wants to have a serious debate with Paul Krugman or anyone else about the data coming from Census Bureau he will first have to learn a bit about the subject matter. Until then, he deserves nothing but ridicule from any serious news outlet.
Read More Leer más Join the discussion Participa en la discusión
How rich would Bill Gates be if anyone in the world could make a computer with the latest version of Windows without even sending him a thank you note? Think about this question as you read Eduardo Porter’s piece on how technology might be shifting income towards capital making society ever more unequal.
Porter is of course right, we have seen a large shift in income from labor to capital across the world over the last three decades. However it is difficult to see how this could be seen as technologically determined when so much of this shift was clearly attributable to patent rents and other laws that certainly were not determined by technology. If current patterns of growth are increasing inequality it is because we have designed a legal and institutional system to bring about this outcome. There is nothing natural about this pattern of development. (in addition to the Bill Gates example, imagine what would happen to Walmart’s profits if it executives faced criminal penalties for violations of labor laws.)
Read More Leer más Join the discussion Participa en la discusión
Last month the WSJ ran a column by Ed Lazear, a Stanford economics professor and former chief economist to President Bush, which noted the decline in the length of the average workweek between the fall and the most recent data from February. The piece noted that if labor demand was measured in hours, we had lost the equivalent of 100,000 jobs over the prior six months. He discussed possible causes for this decline and highlighted the incentives created by the Affordable Care Act.
While some of us at the time questioned the plausibility of this story and noted the likely effect of the weather on reducing workweeks in January and February, we got the question resolved when the March data was released this month. The entire decline in average hours was reversed. The question is whether the WSJ will allow Mr. Lazear a follow-up piece to point out that his earlier concerns about the Affordable Care Act leading to a reduction in the length of the average workweek had apparently been wrong.
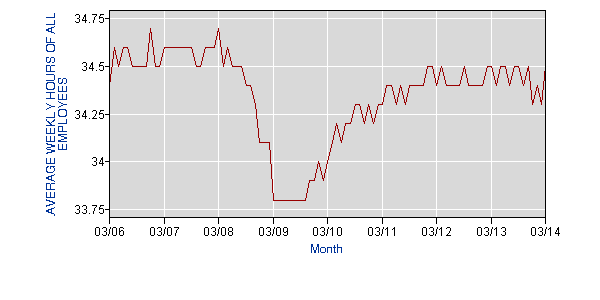
Source: Bureau of Labor Statistics.
Last month the WSJ ran a column by Ed Lazear, a Stanford economics professor and former chief economist to President Bush, which noted the decline in the length of the average workweek between the fall and the most recent data from February. The piece noted that if labor demand was measured in hours, we had lost the equivalent of 100,000 jobs over the prior six months. He discussed possible causes for this decline and highlighted the incentives created by the Affordable Care Act.
While some of us at the time questioned the plausibility of this story and noted the likely effect of the weather on reducing workweeks in January and February, we got the question resolved when the March data was released this month. The entire decline in average hours was reversed. The question is whether the WSJ will allow Mr. Lazear a follow-up piece to point out that his earlier concerns about the Affordable Care Act leading to a reduction in the length of the average workweek had apparently been wrong.
Source: Bureau of Labor Statistics.
Read More Leer más Join the discussion Participa en la discusión
Hey, who isn’t? His column today raises the possibility that because the long-term unemployed are effectively excluded from the labor market, they don’t exert downward pressure on the inflation rate. This means that we should only focus on the short-term unemployment rate, which is already near its average rate over the last two decades.
There are many reasons for not accepting this view. For example, if the number of short-term unemployed dwindled, it is likely that employers would start to look to the longer term unemployed as a source of labor. However even if we accepted the story outlined in Samuelson’s piece, it is difficult to see how anyone could be concerned about the rate of unemployment falling to a level that is inconsistent with stable inflation.
According to the Congressional Budget Office the terms of a trade-off between the acceleration of inflation and unemployment have changed in recent years. In their most recent analysis, they estimated that being a full percentage point below the non-accelerating inflation rate of unemployment (NAIRU) for a full year will lead to a 0.3 percentage point increase in the inflation rate.
This means that if the NAIRU is actually 6.0 percent and the Fed were to flub things and let the unemployment rate fall to 5.0 percent for a full year, then the core consumption expenditure deflator (the Fed’s main measure of inflation) would rise from 1.3 percent to 1.6 percent. Pretty scary stuff.
In short, it’s pretty hard to see the downside risk in this picture. The Fed targets a 2.0 percent rate of inflation, there are arguably reasons we should be looking to an even higher rate (@ 3-4 percent). If we accept the NAIRU story in its entirety and assume that we are already getting close to it, we will still have many years before the inflation rate would rise to a pace that provides a real basis for concern.
Read More Leer más Join the discussion Participa en la discusión
The NYT is continuing its parody of news reporting with a piece that discusses the budget proposals of France’s Prime Minister, Manuel Valls. It told readers:
“On Tuesday, Mr. Valls offered the most detailed summary yet of how the government intends to meet its promise to enact Really Big Number in spending cuts by 2017. He called for Really Big Number in cuts to the central government bureaucracy, Really Big Number to the national health care system and Really Big Number to local governments — an element at which many legislators on the right booed loudly, having just won control of a number of local governments. He did not specify how the remaining Really Big Number in cuts would be made.”
Okay that is not exactly what the piece said. Here’s the actual paragraph:
“On Tuesday, Mr. Valls offered the most detailed summary yet of how the government intends to meet its promise to enact $69 billion in spending cuts by 2017. He called for $26 billion in cuts to the central government bureaucracy, $13.8 billion to the national health care system and $13.8 billion to local governments — an element at which many legislators on the right booed loudly, having just won control of a number of local governments. He did not specify how the remaining $15.4 billion in cuts would be made.”
Did this provide any more information than the “Really Big Number” paragraph? The piece provides no information on how much is currently spent on these programs, nor is it even clear whether these cuts refer to a single year’s spending (presumably 2017), or some aggregate over 2015-2017. The NYT surely has some readers who are sufficiently familiar with France’s budget to make sense of the numbers in this article, but to the other 99.9 percent of readers, these numbers provided no information whatsoever.
Read More Leer más Join the discussion Participa en la discusión
The NYT had an interesting piece on how a rapidly growing number of people are finding rents unaffordable (defined as more than 30 percent of gross income. There are two reasons that rents can rise in price. The first is that the same units cost more money. The second reason is that the mix of rental units change so that the the typical unit costs more.
It is clear that the main cause of higher rents is the latter, as shown below.

This graph shows that the owner equivalent rent index from the Consumer Price Index (CPI) has almost exactly tracked the overall rate of inflation since the start of the century. (I used owner equivalent rent since this excludes the cost of utilities. The cost of utilities has likely outpaced inflation, but that is a somewhat different story.)
If this index from the CPI, which is effectively a quality adjusted price index, is not outpacing inflation, then it implies that the problem must be the quality is getting better. In other words, the units added to the rental housing stock (either by new construction or conversion of ownership units) are either bigger or better in some way than the average rental unit in 2000.
The other factor that could explain a rise in the ratio of the median rental price to income is a decline in real income, which we have seen to some extent in this century. In that case the problem is not really high housing prices, but low wages.
The NYT had an interesting piece on how a rapidly growing number of people are finding rents unaffordable (defined as more than 30 percent of gross income. There are two reasons that rents can rise in price. The first is that the same units cost more money. The second reason is that the mix of rental units change so that the the typical unit costs more.
It is clear that the main cause of higher rents is the latter, as shown below.
This graph shows that the owner equivalent rent index from the Consumer Price Index (CPI) has almost exactly tracked the overall rate of inflation since the start of the century. (I used owner equivalent rent since this excludes the cost of utilities. The cost of utilities has likely outpaced inflation, but that is a somewhat different story.)
If this index from the CPI, which is effectively a quality adjusted price index, is not outpacing inflation, then it implies that the problem must be the quality is getting better. In other words, the units added to the rental housing stock (either by new construction or conversion of ownership units) are either bigger or better in some way than the average rental unit in 2000.
The other factor that could explain a rise in the ratio of the median rental price to income is a decline in real income, which we have seen to some extent in this century. In that case the problem is not really high housing prices, but low wages.
Read More Leer más Join the discussion Participa en la discusión
That’s what readers of this NYT piece must have been asking. It reported:
“It [the I.M.F.] has urged Tokyo to make structural reforms to bolster its labor market, by, for instance, bringing women into the work force.”
This seems strange since the OECD reports that the employment to population ratio for prime age women in Japan (25-54) was 71.5 percent in the third quarter of 2013, the most recent data available. By comparison it was 69.4 percent in the United States.
Addendum:
From comments below and other comments I have received, I realize I need to clarify my point. From all the data I have seen and accounts I have heard, Japan continues to be a very sexist society and women almost certainly face more discrimination than in the United States. I was simply saying that their problem is not bringing women into the workforce. On that score the country has done remarkably well. The employment to population ratio for prime age women rose from 67.6 percent in 2007, before the recession, to 71.5 percent in the most recent quarter. By contrast, in the United States it fell from 72.5 percent to 69.4 percent over the same period. Based on these data , getting women into the labor force is one thing that Japan seems to be doing well.
Note: numbers were corrected to show employment to population ratios for prime age women.
Read More Leer más Join the discussion Participa en la discusión
Expressing concern over deflation (i.e. the inflation rate turning negative) is the way in which people tell you that they have no clue about economics and just repeat what they heard others say. The inflation indexes we use are an aggregation of millions of different price changes. There is a substantial amount of dispersion around the overall inflation number. This means that when the inflation rate is near zero, there are many goods and services whose prices are already falling.
This means that the WSJ discussion of the risks of deflation in the euro zone is rather silly. It tells readers:
“Mr. Draghi said Saturday that he sees no evidence of a broad-based decline in consumer prices, known as deflation, and that there is no sign people are delaying spending in hopes that prices will fall.”
With the euro zone inflation rate at 0.5 percent there are undoubtedly large numbers of goods and services for which prices are declining now. (People may not recognize these price declines since the inflation data use quality adjusted prices. This means that if the price of a computer increases by 5 percent, but its measured rate of quality improvement is 10 percent, then the government statistics will show a 5 percent decline in prices.) If the rate of inflation were to turn negative and become deflation, it simply means that the percentage of items with falling prices has increased.
While a lower inflation rate is worse than a higher inflation rate in the context of a badly depressed economy (it raises real interest rates and makes wage and price adjustments more difficult), there is no consequence to crossing zero. People who understand economics know that deflation doesn’t matter. People who whine about deflation are trying to tell you they don’t understand economics.
Read More Leer más Join the discussion Participa en la discusión
In an otherwise interesting article on bloated CEO paychecks, the NYT almost entirely neglected the role of corporate directors. The directors are the people who determine CEO pay. It is their job first and foremost to hold down CEO pay in the interest of protecting shareholders.
As a practical matter, the directors rarely serve as an effective check on pay because they often owe their position as a director to the CEOs. They tend to view their directorships as a sort of sinecure, giving them hundreds of thousands of dollars a year for attending a small number of board meetings. Many directors serve on multiple boards, sometimes racking up over $1 million a year in the process.
This was the motivation for CEPR’s Director Watch and its partner project with the Huffington Post, Pay Pals. Corporate directors are generally prominent public figures. (This is the reason they are selected.) These people fail the shareholders and really the whole country when they do not impose restraint on CEO pay.
How often at board meetings do they ask if they could get a comparably talented CEO from Europe or Japan, or even China, at a lower cost? Most likely this question is never raised, which means that corporate directors are not doing their job — they are ripping off the shareholders in taking excessive pay while allowing the CEOs to write their own blank checks.
Read More Leer más Join the discussion Participa en la discusión


