


Timothy Lee says that Paul Krugman got it wrong about the resources being wasted in the process of bitcoin mining. Krugman wrote a column based on a NYT piece about a massive bank of computers located in Iceland (low cost electricity) that is devoted to developing complex algorithms that allow the owners to get a large share of newly minted bitcoins.
Lee’s complaint against Krugman is that this mining is actually part of the Bitcoin transactions process. The correct answer to Lee is, so what?
Suppose that some of the people engaged in gold mining are actually armed guards who are there to protect any gold that is recovered. Would these mean that the labor of the armed guards is not being wasted in this totally unproductive exercise? The same applies to the banks of computers calculating algorithms. It doesn’t change anything if they are part of the processing network.
Of course when we have governments that are determined to waste resources by running budgets that leave tens of millions unemployed, even nonsense like Bitcoin mining can be a positive, as Keynes noted. But Krugman is 100 percent right, bitcoin mining is an incredible waste of potentially productive resources, and I said it first.
Read More Leer más Join the discussion Participa en la discusión
Lydia DePillis warns us in the Post of 8 ways that robots will take our jobs. It is amazing how the media have managed to hype the fear of robots taking our jobs at the same time that they have built up fears over huge budget deficits bankrupting the country. You don’t see the connection? Maybe you should be an economics reporter for a leading national news outlet.
Okay, let’s get to basics. The robots taking our jobs story is a story of labor surplus, too many workers, too few jobs. Everything that needs to be done is being done by the robots. There is nothing for the rest of us to do but watch.
There can of course be issues of distribution. If the one percent are able to write laws that allow them to claim everything the robots produce then they can make most of us very poor. But this is still a story of society of plenty. We can have all the food, shelter, health care, clean energy, etc. that we need; the robots can do it for us.
Okay, now let’s flip over to the budget crisis that has the folks at the Washington Post losing sleep. This is a story of scarcity. We are spending so much money on our parents’ and grandparents’ Social Security and Medicare that there is no money left to educate our kids.
Some confused souls may say that the problem may not be an economic one, but rather a fiscal problem. The government can’t raise the tax revenue to pay for both the Social Security and Medicare for the elderly and the education of our kids. This is confused because if we are living in the world where the robots are doing all the work then the government really doesn’t need to raise tax revenue, it can just print the money it needs to back its payments.
Okay, now everyone is completely appalled. The government is just going to print trillions of dollars? That will send inflation through the roof, right? Not in the world where robots are doing all the work it won’t. If we print money it will create more demands for goods and services, which the robots will be happy to supply. As every intro econ graduate knows, inflation is a story of too much money chasing too few goods and services. But in the robots do everything story, the goods and services are quickly generated to meet the demand. Where’s the inflation, robots demanding higher wages?
In short, you can craft a story where we have huge advances in robot technology so that the need for human labor is drastically reduced. You can also craft a story where an aging population leads to too few workers being left to support too many retirees. However, you can’t believe both at the same time unless you write on economic issues for the Washington Post.
Just in case anyone cares about what the data says on these issues, the robots don’t seem to be winning out too quickly. Productivity growth has slowed sharply over the last three years and it is well below the pace of 1947-73 golden age. (Robots are just another form of good old-fashioned productivity growth.)
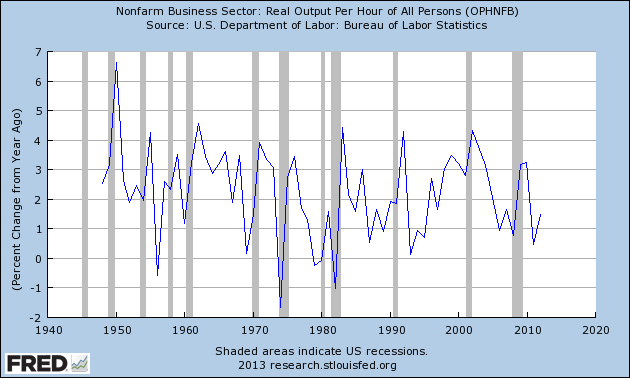
On the other hand, the scarcity mongers don’t have much of a case either. Even if productivity growth stays at just a 1.5 percent annual rate its impact on raising wages and living standards will swamp any conceivable tax increases associated with caring for a larger population of retirees.
Lydia DePillis warns us in the Post of 8 ways that robots will take our jobs. It is amazing how the media have managed to hype the fear of robots taking our jobs at the same time that they have built up fears over huge budget deficits bankrupting the country. You don’t see the connection? Maybe you should be an economics reporter for a leading national news outlet.
Okay, let’s get to basics. The robots taking our jobs story is a story of labor surplus, too many workers, too few jobs. Everything that needs to be done is being done by the robots. There is nothing for the rest of us to do but watch.
There can of course be issues of distribution. If the one percent are able to write laws that allow them to claim everything the robots produce then they can make most of us very poor. But this is still a story of society of plenty. We can have all the food, shelter, health care, clean energy, etc. that we need; the robots can do it for us.
Okay, now let’s flip over to the budget crisis that has the folks at the Washington Post losing sleep. This is a story of scarcity. We are spending so much money on our parents’ and grandparents’ Social Security and Medicare that there is no money left to educate our kids.
Some confused souls may say that the problem may not be an economic one, but rather a fiscal problem. The government can’t raise the tax revenue to pay for both the Social Security and Medicare for the elderly and the education of our kids. This is confused because if we are living in the world where the robots are doing all the work then the government really doesn’t need to raise tax revenue, it can just print the money it needs to back its payments.
Okay, now everyone is completely appalled. The government is just going to print trillions of dollars? That will send inflation through the roof, right? Not in the world where robots are doing all the work it won’t. If we print money it will create more demands for goods and services, which the robots will be happy to supply. As every intro econ graduate knows, inflation is a story of too much money chasing too few goods and services. But in the robots do everything story, the goods and services are quickly generated to meet the demand. Where’s the inflation, robots demanding higher wages?
In short, you can craft a story where we have huge advances in robot technology so that the need for human labor is drastically reduced. You can also craft a story where an aging population leads to too few workers being left to support too many retirees. However, you can’t believe both at the same time unless you write on economic issues for the Washington Post.
Just in case anyone cares about what the data says on these issues, the robots don’t seem to be winning out too quickly. Productivity growth has slowed sharply over the last three years and it is well below the pace of 1947-73 golden age. (Robots are just another form of good old-fashioned productivity growth.)
On the other hand, the scarcity mongers don’t have much of a case either. Even if productivity growth stays at just a 1.5 percent annual rate its impact on raising wages and living standards will swamp any conceivable tax increases associated with caring for a larger population of retirees.
Read More Leer más Join the discussion Participa en la discusión
Read More Leer más Join the discussion Participa en la discusión
When people just start making things up it usually means that they don’t have much of an argument. That appears to be the case with the bashers of Obamacare over at the Wall Street Journal.
Robert Grady, a managing director of a private equity company and top adviser to New Jersey Governor Chris Christie told readers:
“For most of this year, the overwhelming majority of jobs added to the U.S. economy have been part-time, not full-time. Gallup’s payroll-to-population ratio, the proportion of the American population working full time, has dropped almost two full percentage points in the last year, to 43.8%.”
These are great numbers because they can be easily checked. If we go the Bureau of Labor Statistics website (Table A-8), we find that the number of people listed as part for economic reasons fell from 8,138,000 in November of last year to 7,719,000 in November of this year, a decline of 419,000.
The number of people opting to work part-time rose from 18,594,000 in November of last year to 18,876,000 in November of 2013, a gain of 282,000. If we add the drop in part-time for economic reasons to the gain in voluntary part-time, we get a drop in total part-time employment of 137,000.
By comparison, total employment (Table A-1) rose from 143,277,000 last November to 144,386,000, a gain of 1,109,000. Okay, so we have that part-time employment fell by 137,000 while total employment rose by 1.1 million, how do Grady and the WSJ get that part-time employment is exploding because of Obamacare?
Hey, night is day, black is white, up is down, meet the just make it up crew at the WSJ.
Read More Leer más Join the discussion Participa en la discusión
The NYT gave readers an excellent example of how the financial sector can lead to an enormous waste of economic resources. It reported on a massive set of sophisticated computers in Iceland that is devoted to the sole purpose of “mining” bitcoins. The point is that these computers are used to carry through complex algorithms more quickly than competitors in order to lay claim to new bitcoins as they become available on the markets.
While this can be quite profitable to an individual or firm that successfully claims a substantial portion of the newly created bit coins, it provides nothing of value to the economy as a whole. It is a case of pure rent-seeking, where large amount of resources are devoted to pulling away wealth that is created in other sectors. This is the story of much of the activity in the financial sector, such as high-frequency trading or the tax gaming that is the specialty of the private equity industry, but in few cases is the rent-seeking so clear and unambiguous. The NYT did a valuable service by presenting this example.
Read More Leer más Join the discussion Participa en la discusión
It sure seems that way as he implies that greater patent and copyright protection are the wave of the future. He tells readers:
“The growing commitment of the American political system to intellectual-property protection and enforcement, like that in trade treaties, also hasn’t gained much explicit notice. This shift of priorities is likely to become more important as economies move toward creative production and information technology.”
Already we lose close to $270 billion in patent rents on pharmaceuticals alone. This is roughly 1.6 percent of GDP or more than three times what the government spends on food stamps each year. This is money that is wasted paying more than free market price for drugs, which would almost invariably be cheap ($5-$10 per prescription) absent these government granted monopolies.
Even worse, patents monopolies give huge incentives to drug companies to lie to the public about the safety and effectiveness of their drugs. They routinely conceal or misrepresent information, just as economic theory predicts. There are more efficient ways to finance the development of drugs, but apparently Cowen thinks the drug industry will be sufficiently powerful from having them be considered in public policy debates. (Thus far he has been right.)
Government granted patent monopolies also likely slow innovation in other areas as well, most notably in the high tech sector where companies like Apple and Samsung compete at least as much in the courtroom over patent suits as in the marketplace.
Read More Leer más Join the discussion Participa en la discusión
Sorry, for family reasons I am seeing the Sunday morning shows. It’s amazing these things exist. David Gregory is interviewing Yuval Levin about his book Tyranny of Reason, Imagining the Future, The Great Debate: Edmund Burke, Thomas Paine, and the Birth of Left and Right.
The book sounds like collection of painful cliches, the left likes activist government, the right believes in leaving civil society to work things out for itself. Really? So the patents and copyrights that shift far more money to the wealthy than food stamps and TANF shift to the poor are just civil society, not activist government. Trade policies that put downward pressure on the wages of most workers, while largely protecting doctors and other highly paid professionals are also just civil society, not activist government. Bank bailouts and no cost too big to fail insurance for the big banks are just civil society, not activist government.
There is a much longer list of such policies in my book The End of Loser Liberalism: Making Markets Progressive (free download available). There is zero evidence that either Levin or Gregory has ever heard of any of these arguments. They are determined to just repeat tired cliches that have nothing to do with actual politics.
The cliches of course do help to advance a right-wing agenda. It sounds much better to say that the rich got really rich by the natural workings of the market rather than by paying off the ref to write the rules to benefit themselves. The reality might be much closer to the latter, but Gregory and Levin apparently don’t even want anyone to think about such possibilities.
Read More Leer más Join the discussion Participa en la discusión
The Commerce Department released its second revision to the third quarter GDP numbers on Friday. It showed the economy growing 4.1 percent, which was better than the earlier reports and more than most analysts had expected. However, the Post got more than a bit carried away on this one, telling readers in the second sentence of its article on the report:
“The Commerce Department reported that the nation’s gross domestic product grew at a 4.1 percent annual rate during the third quarter — the best showing since 1992.”
Really? How about the 4.9 percent growth rate in the fourth quarter of 2011, less than two years ago? Then we had a 4.9 percent growth rate in the first quarter of 2006 and a 4.5 percent growth rate in the first quarter of 2005. In total I find 17 quarters since 1992 with growth rates higher than 4.1 percent. So that one seems a bit off.
Furthermore, as the article notes in passing, most of the better than expected performance was due to inventory accumulations which added 1.7 percentage points to the growth reported for the quarter. The economy reportedly accumulated inventories at annual rate of $115.7 billion in the third quarter, an absolute pace exceeded only by the $116.2 billion rate in the third quarter of 2011. In the fourth quarter, if the economy adds inventories at the same rate as it did in the prior two years, and the rest of the economy grows at the same pace as it did in the third quarter, then the growth rate will be less than 1.0 percent.
Read More Leer más Join the discussion Participa en la discusión
Many of us are happy to see that Larry Summers, who served as President Clinton’s Treasury Secretary and head of President Obama’s National Economic Council, had a column talking about secular stagnation in the Washington Post. As they say here in Washington, if you repeat something that is true long enough, Larry Summers will eventually write about it in the Washington Post.
Unfortunately, Summers still only has part of the story. He notes the possibility that investment demand may have shifted downward because of slower population growth. He also notes that upward redistribution of income may have reduced consumption, since the rich tend to save a larger share of their income than the poor and middle class. It is great to see these points being made by a distinguished economist, however Summers continues to miss the most obvious drain on demand: the trade deficit.
The trade deficit is running at a $500 billion annual pace, more than 3.0 percent of GDP. This is demand that is going to other countries, not the United States. If we snapped our fingers and made the trade deficit zero tomorrow it would translate into roughly 4.2 million jobs directly and another 2.1 million indirectly through multiplier effects for a total of 6.3 million jobs. In other words, this is a big deal.
By comparison, the shift in income from everyone else to the one percent was equal to roughly 10 percentage points of personal income. If we assume that the rich spend 75 percent of this increment and everyone else would have spent roughly 95 percent, then the difference is 2 percentage points of personal income or around 1.6 percentage points of GDP. That is a bit more than half as much as the contribution of the trade deficit.
Summers should know about the trade deficit since he is one of the people most responsible for the deficits we face today. It was his engineering of the IMF bailout of countries from the East Asian financial crisis (with Alan Greenspan and Robert Rubin as accomplices, and Stanley Fisher at the IMF playing a supporting role) that led to the sharp over-valuation of the dollar that gave us large trade deficits.
In standard textbook economics, capital is supposed to flow from rich countries like the United States to poor countries in the developing world which can better use the capital. This implies that rich countries would have trade surpluses, not deficits. This actually was more or less happening in the years prior to the crisis in 1997. Developing countries were on net borrowers.
However the terms of the bailout were viewed as so onerous that countries throughout the developing world decided that they had to accumulate as many reserves as possible in order to avoid ever being in the same situation with the IMF. This meant deliberately keeping the value of their currencies down against the dollar and running large trade surpluses. This corresponds to the large trade deficit run by the United States.
In short, Larry Summers certainly should know about the trade deficit, he helped give it to us. If we want to reverse secular stagnation a very good place to look would be a smaller trade deficit brought about by a lower valued dollar. (We can also cope with a chronic shortfall in aggregate demand by shortening work hours, as Germany has done. Summers apparently opposes this route because he has decided that this is not the American Way.)
Read More Leer más Join the discussion Participa en la discusión
Yes folks, the NYT is trying to dislodge Fox News. What they may lack in outrageousness they make up in credibility. Here they are with a front page story telling us about the tragic situation of the Chapmans, a New Hampshire couple making $100,000 a year who will have to spend $1,000 a month for insurance with Obamacare. This would come to 12 percent of their income. The piece tells readers:
“Experts consider health insurance unaffordable once it exceeds 10 percent of annual income.”
That’s interesting. If we go to the Kaiser Family Foundation website we find that the average employee contribution for an employer provided family plan is $4,240. The average employer contribution is $11,240. That gives us a total of $15,470. Most economists would say that we should treat the employers payment as a cost to the worker since in general employers are no more happy to pay money to health insurance companies than to their workers. If they didn’t pay this money as health insurance then they would be paying it to their workers in wages.
If we say that this family has a $70,000 annual income (roughly the median for two earner couples), then the cost of the health care policy would be close to 20 percent of their income, even adding in the $11,240 employer contribution to their income. This would mean the experts consulted by the NYT would think that most of the families with insurance have unaffordable insurance.
In this respect, the $1,000 a month that the Chapmans are paying under Obamacare looks pretty damn good. It is more than 20 percent less expensive than the average policy in the Kaiser survey. Of course a lot depends on what is covered and the extent of the deductibles, but based on the information given in the NYT article there is no reason that anyone should be shedding tears for the Chapmans.
Read More Leer más Join the discussion Participa en la discusión


