


It’s always good to see CEPR’s research findings picked up in the NYT even if someone else had to do them. In this case, the NYT reports that the Affordable Care Act is not leading to more part-time work. Yes, we showed that two months ago. But hey, the lag is getting much shorter. After all, we warned that the collapse of the housing bubble could lead to a severe recession and serious financial consequences back in 2002. They didn’t begin to take that one seriously until the collapse was already in progress.
It’s always good to see CEPR’s research findings picked up in the NYT even if someone else had to do them. In this case, the NYT reports that the Affordable Care Act is not leading to more part-time work. Yes, we showed that two months ago. But hey, the lag is getting much shorter. After all, we warned that the collapse of the housing bubble could lead to a severe recession and serious financial consequences back in 2002. They didn’t begin to take that one seriously until the collapse was already in progress.
Read More Leer más Join the discussion Participa en la discusión
If you ever wondered where all the psychics came from who hang their shingles around DC, the answer is that they are probably former Washington Post reporters. The paper again told readers what people think. In an article on how the latest battle over Obamacare has re-energized the Tea Party, the Post told readers:
“Obamacare, which seeks to extend health coverage to millions of uninsured Americans, is viewed by tea party activists as a dangerous new government intrusion. They fear it will reduce their choices of medical providers and burden the weak economy.”
Of course the Post has no clue as to how tea party activists actually view Obamacare or what they fear. Many may fear that the government will send death panels into their homes to deny them or their loved ones care since this is what many of their leaders have asserted. A real newspaper would report on what people say and leave speculation about their fears and beliefs to others.
Read More Leer más Join the discussion Participa en la discusión
Last week I blamed the media in general and the New York Times in particular for the battle over the Republican proposal to cut food stamps. The logic is that the media routinely report that the Republicans want to cut $4 billion from the program. Undoubtedly many people hearing this number believe that it constitutes a major expense for the federal government.
The proposed cut to the program is actually equal to just 0.086 percent of federal spending. In other words, it could make a big difference to the people directly affected, but it makes almost no difference in terms of the overall budget. Very few people understand this fact because $4 billion sounds like a lot of money. The media could help to clear up this confusion by reporting the number as a share of the budget, but they don’t do that because — I don’t know.
Anyhow, for those who would like some further context for this proposed cut to the food stamp program we can consider the impact of raising wages on food stamp spending, specifically the wages of Walmart workers. The pay of many Walmart workers is not much above the minimum wage. As a result, a large percentage of Walmart workers qualify for government benefits like food stamps.
By contrast, if the wages of workers at the bottom end of the labor market had kept pace with productivity growth over the last 45 years it would be almost $17.00 an hour today. In that situation, very few Walmart workers would qualify for government benefits.
Earlier this year, the Democratic staff of the House Committee on Education and the Workforce put together calculations for the range of costs to the government through various programs of a Walmart superstore in Wisconsin that employs 300 workers. They put a range for the cost of food stamp benefits for a single store at between $96,000 and $219,500.
According to Fortune Magazine, Walmart has 2.1 million employees nationwide, which means that we should multiply these numbers by 7,000 to get a national total. That puts the annual cost of food stamps for the families of Walmart workers at between $670 million and $1.54 billion. The figure below shows the potential savings to taxpayers from raising the wages of Walmart workers to a level where they don’t qualify for food stamps with the savings from the Republicans’ proposed cuts to the program.
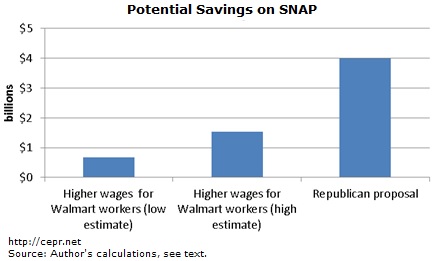
In short, if the goal is to save taxpayers money on food stamps there are different ways of achieving it. One is to cut benefits, as the Republicans have proposed. The other is to increase wages for low-paid workers so that they no longer qualify for benefits like food stamps.
Last week I blamed the media in general and the New York Times in particular for the battle over the Republican proposal to cut food stamps. The logic is that the media routinely report that the Republicans want to cut $4 billion from the program. Undoubtedly many people hearing this number believe that it constitutes a major expense for the federal government.
The proposed cut to the program is actually equal to just 0.086 percent of federal spending. In other words, it could make a big difference to the people directly affected, but it makes almost no difference in terms of the overall budget. Very few people understand this fact because $4 billion sounds like a lot of money. The media could help to clear up this confusion by reporting the number as a share of the budget, but they don’t do that because — I don’t know.
Anyhow, for those who would like some further context for this proposed cut to the food stamp program we can consider the impact of raising wages on food stamp spending, specifically the wages of Walmart workers. The pay of many Walmart workers is not much above the minimum wage. As a result, a large percentage of Walmart workers qualify for government benefits like food stamps.
By contrast, if the wages of workers at the bottom end of the labor market had kept pace with productivity growth over the last 45 years it would be almost $17.00 an hour today. In that situation, very few Walmart workers would qualify for government benefits.
Earlier this year, the Democratic staff of the House Committee on Education and the Workforce put together calculations for the range of costs to the government through various programs of a Walmart superstore in Wisconsin that employs 300 workers. They put a range for the cost of food stamp benefits for a single store at between $96,000 and $219,500.
According to Fortune Magazine, Walmart has 2.1 million employees nationwide, which means that we should multiply these numbers by 7,000 to get a national total. That puts the annual cost of food stamps for the families of Walmart workers at between $670 million and $1.54 billion. The figure below shows the potential savings to taxpayers from raising the wages of Walmart workers to a level where they don’t qualify for food stamps with the savings from the Republicans’ proposed cuts to the program.
In short, if the goal is to save taxpayers money on food stamps there are different ways of achieving it. One is to cut benefits, as the Republicans have proposed. The other is to increase wages for low-paid workers so that they no longer qualify for benefits like food stamps.
Read More Leer más Join the discussion Participa en la discusión
We all should be thankful for the vigilance of the Washington Post, otherwise we might not know about an agency in Alaska that could be wasting around $1.8 million a year in federal spending. The Post decided to do a major story on the inspector general of a small development agency in Alaska who wrote a letter to Congress saying that the agency was a waste of money and should be closed.
According to the piece, the agency, the Denali Commission, was the creation of former Alaska Senator Ted Stevens. At one time more than $150 million was flowing through it to finance various projects in Alaska. This flow has been reduced to $10.6 million following Senator Steven’s defeat and subsequent death.
The immediate issue according to the inspector general is not the $10.6 million in projects, many or all of which may be worthwhile, but rather the agency itself. The inspector general complained that it was an unnecessary intermediary for these funds and therefore a waste of taxpayer dollars.
The article indicates that the agency has 12 employees. If we assume that total compensation for each, plus the indirect costs associated with running the office, come to $150,000 a year, then the implied waste would be $1.8 million a year, assuming that no equivalent supervisory structure would need to be established elsewhere in Alaska’s government.
If we go to CEPR’s incredibly spiffy budget calculator, we see that this spending qualifies as less than 0.0001 percent of the budget. Clearly this article was a good use of a Post’s reporter’s time and way to consume a large chunk of space in the newspaper.
Read More Leer más Join the discussion Participa en la discusión
The NYT Room for Debate section must have caught many readers by surprise on Thursday when it posed the question of whether economic growth was essential for mobility and it held Mexico up as an example of a dynamic economy. The reason this might have been a surprise is that Mexico has mostly been a growth laggard. It’s growth rate has generally been considerably slower than the growth rate of other Latin American countries and is projected to remain slower in the foreseeable future.
The NYT Room for Debate section must have caught many readers by surprise on Thursday when it posed the question of whether economic growth was essential for mobility and it held Mexico up as an example of a dynamic economy. The reason this might have been a surprise is that Mexico has mostly been a growth laggard. It’s growth rate has generally been considerably slower than the growth rate of other Latin American countries and is projected to remain slower in the foreseeable future.
Read More Leer más Join the discussion Participa en la discusión
The Washington Post ran an article highlighting new calculations of city pension liabilities from Moody’s, the bond rating agency. Moody’s is probably best known to most people for rating hundreds of billions of dollars’ worth of subprime mortgage backed securities as investment grade during the housing bubble years. It received tens of millions of dollars in fees for these ratings from the investment banks that issued these securities.
The new pension liability figures are obtained by using a discount rate for pension liabilities that is considerably lower than the expected rate of return on pension assets. This methodology increases pension liabilities by around 50 percent compared with the traditional method.
If a pension fund was fully funded according to the new Moody’s methodology, but continued to invest in a mix of assets that gave a much higher rate of return than the discount rate used for calculating liabilities, then it would have effectively overfunded its pension. That would mean taxing current taxpayers more than necessary in order to allow future taxpayers to pay substantially less in taxes to finance public services. Usually economists believe that each generation should pay taxes that are roughly proportional to the services they receive. Moody’s methodology would not lead to this result if it became the basis for pension funding decisions.
It would have been worth highlighting this point about the Moody’s methodology. Most readers are unlikely to be aware of the strange policy implications of following the methodology and thereby assume that governments would be wrong not to accept it.
It is worth noting that public pensions did grossly exaggerate the expected returns on their assets in the stock bubble years of the late 1990s and at the market peaks hit in the last decade. Unfortunately, unlike some of us, Moody’s did not point this problem out at the time. One result was that many state and local governments raised their pensions and made additional payouts to workers which would not have been justified if they had used a discount rate that was consistent with the expected return on their assets.
Read More Leer más Join the discussion Participa en la discusión
You know times are bad when people start making a big deal about finding pennies in the street. That seems to be the case these days at the European Central Bank.
According to the New York Times, Joerg Asmussen, an Executive Board member of the European Central Bank, touted the growth potential of a trade agreement between the European Union and the United States. A study by the Centre for Economic and Policy Research in the United Kingdom (no connection to CEPR) found that in a best case scenario a deal would increase GDP in the United States by 0.39 percentage points when the impact is fully felt in 2027 (Table 16). In their more likely middle scenario, the gains to the United States would be 0.21 percent. That would translate into an increase in the annual growth rate of 0.015 percentage points.
While the gains for Europe might be slightly higher, it is worth noting that this projection does not take account of ways that a deal could slow growth, for example by increasing protections for intellectual property and putting in place investment rules that increase economic rents. It reveals a great deal about current economic prospects that a top policy official in the European Union would be touting such small potential benefits to growth.
Read More Leer más Join the discussion Participa en la discusión
Read More Leer más Join the discussion Participa en la discusión
Obamacare may be more confusing than many people realized. Apparently even the NYT is unable to get it straight.
In an article that detailed the cost of the plans in the exchange for various types of families in each of the 50 states, the NYT told readers:
“The figures, almost by definition, provide a favorable view of costs, highlighting the least expensive coverage in each state.”
This is clearly not true. The numbers featured in the article were for the second lowest cost silver plan in the exchanges. Silver plans are supposed to cover approximately 70 percent of patients’ medical expenses. By definition they would be expected to cost more than bronze plans, which target 60 percent of patients’ health care expenses. The silver plans by definition are not the least expensive coverage in the state. (To get a bit technical, the second lowest cost plan is also more expensive than the lowest cost plan.)
The numbers featured in the article (which apparently are being highlighted by the Obama administration) are likely to be typical of the costs that patients will see. As the article notes, there are variations within states and people will have an option to find both higher and lower cost plans, but these numbers are not obviously skewed to either the high or low side.
Read More Leer más Join the discussion Participa en la discusión
The Washington Post had a lengthy article on Florida Representative Steve Southerland’s efforts to cut food stamp spending by $40 billion over the next decade. Since it never put this figure in any context, many readers may have mistakenly been led to believe that there is real money at stake.
While this proposed cut may make a huge difference to the affected population, it will have no noticeable impact on the federal budget.
Read More Leer más Join the discussion Participa en la discusión


