


Paul Krugman devotes his column today to the unreality of the debate in Washington on the budget and the deficit. Towards the end of the piece he refers Erskine Bowles and Alan Simpson the co-chairs of President Obama’s deficit commission:
“People like Alan Simpson and Erskine Bowles, the co-chairmen of President Obama’s deficit commission, did a lot to feed public anxiety about the deficit when it was high. Their report was ominously titled ‘The Moment of Truth.'”
While Krugman is correct in referring to the report as “their report,” Simpson and Bowles were not so honest. The website for the commission refers to the report as the “report of the national commission on fiscal responsibility and reform.” However, this is not true.
Those who prefer truth to truthiness might notice that the bylaws say:
“The Commission shall vote on the approval of a final report containing a set of recommendations to achieve the objectives set forth in the Charter no later than December 1, 2010. The issuance of a final report of the Commission shall require the approval of not less than 14 of the 18 members of the Commission.”
There in fact is no record of an official vote of the commisssion and certainly not by the December 1, 2010 deadline. There was an informal vote of December 3rd, in which 11 of the commission’s members, 3 fewer than required under the by-laws, voted in favor of the final report.
Therefore under the bylaws that govern the operation of the commission, there was no final report. In other words, the “moment of truth” was a lie. The report that appears as the commission’s “report” is not in fact a report of the commission.
Read More Leer más Join the discussion Participa en la discusión
Readers might think that they would after reading Wonkblog’s piece, “Five facts about household debt in the United States.” The piece begins by telling readers:
“The U.S. economy has been growing glacially for the last four years. And, by almost all tellings, the overhang of debt from the pre-crisis years is a big part of the reason why.”
Is that so? There seems to be a very simple story that does not hinge on debt overhang. When the housing bubble collapsed it destroyed $8 trillion iin housing wealth. This bubble wealth was driving the economy in two ways.
First, record high house prices led to an extraordinary construction boom. Residential construction, which is normally around 3.5 percent of GDP, surged to more than 6.0 percent of GDP at its peak in 2005. After the collapse of the bubble, the overbuilding led to a period of well-below-normal levels, with construction falling to less than 2.0 percent of GDP. The difference of more than 4 percentage points of GDP implies a loss in annual demand of around $640 billion in today’s economy. (Residential construction is now recovering and is currently a bit more than 3.0 percent of GDP.)
The other way that the housing bubble was driving the economy was through the housing wealth effect. Economists estimate that homeowners increase their consumption by 5-7 cents for each additional dollar of home equity. This would imply that bubble wealth increased annual consumption by $400 to $560 billion a year. When the bubble wealth disappeared, so did this excess consumption.
The question then is where does debt figure into this picture? The answer is it doesn’t really. People will spend based on their equity, net of debt. This means that we would expect a person with a $300,000 home and a $100,000 mortgage to spend roughly the same amount as a result of her housing equity as a person with a $200,000 home and no mortgage. It is the amount of equity that matters, not the amount of debt.
This doesn’t mean that there may not be some differences across households. If the value of Bill Gates’ home rises by $10 million, it would probably have less effect on consumption than if 100 miiddle income homeowners saw the price of their homes increase by an average of $100,000. But this has nothing directly to do with debt. It is a question of the distribution of wealth.
In fact, it is just wrong to imply that consumption is currently depressed. It isn’t. The saving rate in the first half of 2013 was less than 4.3 percent. This is less than half of the average saving rate in the 1960s, 1970s, and 1980s. It is lower than the saving rate at any points in the post-ware era except the peaks of the stock and housing bubbles. Unless we see a return of a bubble, there is no reason to expect consumption to increase further relative to income.
The reality is, consumption is high, not low. This is yet another which way is up problem in economics.
We still see a slump because of the unmentionable trade deficit. We need a source of demand to replace the demand lost to this deficit, as widely recognized by fans of national income accounting everywhere.
Read More Leer más Join the discussion Participa en la discusión
It is standard practice in elite circles to blame U.S. workers for their lack of jobs and low wages. The problem is they lack the right skills to compete in the global economy. The NYT gave us another example of this complaint with Stephan Richter’s column today.
While it would be desirable to have a better trained and educated workforce, the reason why our manufacturing workers lose out to international competition, while highly educated workers like doctors and lawyers don’t, is that the latter are highly protected. By contrast, it has been explicit policy to put manufacturing workers in direct competition with the lowest paid workers in the developing world.
If we had free traders directing policy, our trade deals would have been as focused on removing the barriers that make it difficult for smart and ambituous kids in the developing world from becoming doctors, dentists, and lawyers in the United States. This would have driven down wages in these fields and led to enormous savings to consumers on health care, legal fees and other professional services. However trade policy in the United States has been dominated by protectionists who want to limit competition for the most highly paid workers, while using international competition to drive down the wages for those workers at the middle and bottom of the pay ladder.
Read More Leer más Join the discussion Participa en la discusión
The NYT ran a Reuters piece touting the UK’s return to growth after enduring a prolonged period of recession and stagnation. It would have been worth mentioning that even on its current path, the UK will just be passing its 2008 level of output in 2014. Even with the return to growth, the IMF projects that per capita GDP in the UK will not pass its 2007 level until 2018.
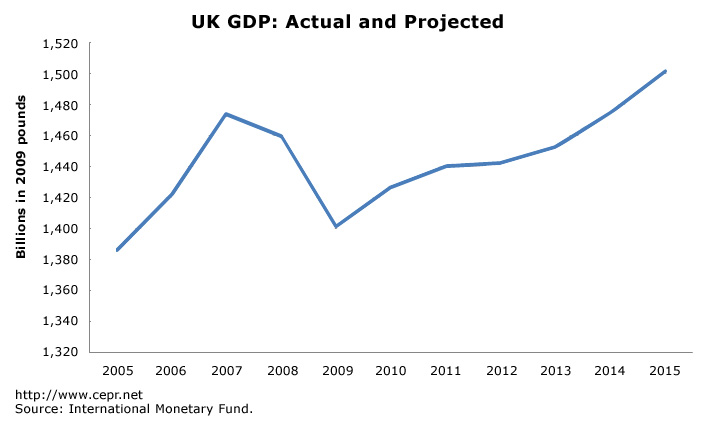
Source: International Monetary Fund.
The NYT ran a Reuters piece touting the UK’s return to growth after enduring a prolonged period of recession and stagnation. It would have been worth mentioning that even on its current path, the UK will just be passing its 2008 level of output in 2014. Even with the return to growth, the IMF projects that per capita GDP in the UK will not pass its 2007 level until 2018.
Source: International Monetary Fund.
Read More Leer más Join the discussion Participa en la discusión
That’s a good question, but this Washington Post article probably won’t help people answer it. A 0.3 percent growth rate sounds depressingly close to zero, but in fact this number refers to the quarterly growth, not the annual growth rate, which is the standard way of reporting growth numbers in the United States.
This one should be really simple. GDP growth data in the U.S. is always reported as an annual rate. Did anyone see a report that the U.S. economy grew 0.4 percent in the second quarter? Multiplying by four will quickly transform these quarterly growth numbers into annual rates. (Okay, to be precise you want to take the growth to the fourth power, as in 1.003^4.) There is no excuse for not reporting GDP growth numbers in a way that would make their meaning clear to most readers.
FWIW, I can’t tell you whether the euro zone should be happy or mourning its 1.2 percent growth rate in the second quarter. Given the severity of its downturn, it’s not much of a bounceback. On the other hand, it is certainly better than seeing another fall in output.
Read More Leer más Join the discussion Participa en la discusión
Neil Irwin has a discussion of the growth potential of the U.S. economy that follows the work of two JP Morgan economists. The basic story is quite pessimistic, arguing that we will see rapid declines in labor force participation and much slower productivity growth in the future. I won’t comment on these points at length here (the evidence presented is limited in the piece and weak), but will rather focus on the conclusion.
The piece ends by warning readers:
“And if the analysis is right, and we have downshifted to a slower pace of potential growth, we will hit the speed limit of this recovery — the point at which inflation becomes a risk — sooner than forecasters are commonly thinking.”
The standard theory about the causes of inflation is based on the unemployment rates. Folks have probably heard of the non-accelerating inflation rate of unemployment (NAIRU). The logic of this theory is that at lower rates of unemployment there is more upward pressure on wages and prices, meaning that the inflation rate increases. At higher rates of unemployment there is less upward pressure on wages and prices, which means the rate of inflation decreases.
The NAIRU is that wonderful level of unemployment at which the inflation rate will stay constant. For true believers, it is the unemployment rate that the Fed would target since it is the lowest unemployment consistent with a stable rate of inflation.
There are lots of good criticisms of this view, but some permutation of it dominates the vast majority of mainstream thinking about the economy. Note that it does not say anything about growth. The non-accelerating inflation rate of unemployment is a story about unemployment, as the name implies.
Growth can enter into the picture if the unemployment rate is actually at the NAIRU. In this situation, if the economy grows at a rate faster than its potential (it can do this for short periods of time), then the unemployment rate would fall below the NAIRU and we would then see accelerating inflation. But the key variable in this picture is still unemployment, not growth.
This is important for two reasons. First, there is no limit on the economy’s ability to acheive rapid growth as long as we have an unemployment rate above the NAIRU. Even if the rate of growth of potential GDP is just 2.0 percent, the economy can still have a spurt of 6 percent, 7 percent, or even 8 percent, as long as there is large amounts of slack in the economy, as is the case today.
The other point is that unemployment is something that people see and experience. Growth is not. The key economic debate is how low the unemployment rate can go — how many people can have jobs — not how fast the economy can grow. We will find that out when we get the unemployment rate as low as possible without serious problems with inflation.
Read More Leer más Join the discussion Participa en la discusión
Readers of the Financial Times will undoubtedly be looking for this headline in future editions after seeing that:
“Berlin and Brussels credit fiscal discipline and reform for euro zone recovery.”
As predicted by non-members of the flat earth society everywhere, the “fiscal discipline” pushed by Berlin and Brussels has led to severe recessions across much of Europe.The story is very simple. In the middle of a severe downturn, cutting back government spending and/or raising taxes lowers demand. There is no reason to think that firms will invest more or consumers will buy more simply because the government is spending less. Recent research from the IMF has confirmed this to be the case.
But just as any non-fatal beating eventually ends, the decline in GDP due to government cutbacks may finally have reached an endpoint.
Apparently in Berlin and Brussels they consider it cause for celebration that their policies did not lead to a permanently declining economy. This is known as the soft bigotry of incredibly low expectations.
Read More Leer más Join the discussion Participa en la discusión
The NYT devoted an article to Germany’s declining population, which it warns may lead to a “major labor shortage” according to unnamed experts. The piece warns that this is not only a potential crisis for Germany, but in fact all of Europe, telling readers:
“There is little doubt about the urgency of the crisis for Europe.”
The piece is confused throughout, apparently misunderstanding the way markets work. At one point it tells readers that German employers have “hundreds of thousands of skilled jobs unfilled.” In fact this just means that these employers are unwilling to pay the market wage for these jobs.
That happens all the time as economies evolve. The reason that half of the U.S. workforce does not work in agriculture is that farmers had millions of jobs unfilled because workers could get better paying jobs in cities. The farmers that went out of business were undoubtedly made unhappy by being unable to get low cost labor for their farms, but it’s unlikely the NYT called it a crisis as it was happening.
If the labor market tightens in response to a declining population then low productivity jobs will go unfilled. For example, there will be fewer clerks in retail stores to assist customers and many restaurants will close since restaurant workers will be able to get higher wages. If the jobs that are unfilled are important to the economy, then presumably employers will offer higher wages and be able to pull workers away from other jobs or persuade more workers to get the skills necessary for the positions.
The other misleading fear story in this picture is the idea that a declining working age population will not be able to support a larger population of retirees:
“There are about four workers for every pensioner in the European Union. By 2060, the average will drop to two, according to the European Union’s 2012 report on aging.”
This is bizarre for several reasons. First, right now Europe is suffering enormously because it has way too many workers to support its population of retirees, which is why countries like Spain and Italy have double-digit unemployment (25 percent in the case of Spain). It’s understandable that labor shortages would not figure prominently as a concern to many Europeans just now.
However, the underlying arithmetic here is also misleading. Countries have dealt with declining ratios of workers to retirees for close to a century, and for the most part without much difficulty. In the United States the ratio fell from 5 to 1 in 1960 to just 2.8 to 1 in 2012. This did not prevent large improvements in living standards for both workers and retirees. It is hard to see why a comparable drop in the next 50 years in the European Union would lead to serious disruptions. (Actually it is surprising that the ratio of workers to retirees is so much higher in Europe than the United States since the EU does have an older population.)
Simple arithmetic shows that the impact of productivity growth will swamp the impact of demographics. If a retiree gets 80 percent of the income of an average worker, then it is necessary to have a tax rate (or its equivalent) of just under 17 percent on workers when the ratio of workers to retiree is 4 to 1. The necessary tax rate would be a bit less than 29 percent if the ratio is just 2 to 1.
If the country is able to maintain just a 1.5 percent rate of productivity growth over this 50 year period (the pace of growth during the slowdown period in the United States) and wages keep pace with productivity growth, then before tax wages will be 110 percent higher in 2062 than they are today. This would leave after-tax wages more than 80 percent higher than today. It’s difficult to see why Europeans should be viewing this as a crisis.
Read More Leer más Join the discussion Participa en la discusión
The supporters of Larry Summers drive to be Fed chair are desperately trying to rewrite history so that this world class champion of financial deregulation was actually a prescient supporter of tighter regulation all along. Exhibit A in this historical rewriting is a report on predatory lending that the Department of Housing and Urban Development (HUD) and the Treasury Department put out in 2000, when Summers was Treasury Secretary. The report is featured as an example of Summers’ commitment to regulation in a NYT article comparing Larry Summers’ and Janet Yellen’s record on regulation.
The report contains many sound recommendations about requiring lenders to better disclose terms of loans, limiting loan flipping, and sharply restricting the use of prepayment penalties. The article tells readers:
“The report recommended modest changes in federal law but Congress, then controlled by Republicans, made none. The Fed and other banking regulators also ignored the findings.”
If readers are unfamiliar with this history of Larry Summers as a crusader for regulations protecting consumers, they can be forgiven. Summers was apparently unable to get even a single mention for this report in the New York Times in the month it was issued. Furthermore, it is inaccurate to imply that the report was a major departure from views held at the time by all Republicans or even Federal Reserve Board Chairman Alan Greenspan.
A NYT article from April 2, 2000 began by telling readers:
“After several years of inaction, pressure is building in Washington to impose tighter rules on banks and finance companies that specialize in lending money to homeowners with blemished credit records.
“Representative Jim Leach, the Iowa Republican who is chairman of the House Banking Committee, said last week that his committee would be pressing for more vigorous enforcement of a law adopted in 1994 to combat deceptive lending practices, and may do more.”
Later the piece added:
“all four federal banking regulators — including Alan Greenspan, chairman of the Federal Reserve — had spoken out against deceptive lending practices, and some are beginning to develop new regulations.”
The piece then goes on to cite comments from Franklin Raines, then the CEO of Fannie Mae, about cutting off access to funds to abusive lenders. It then tells readers;
“Wall Street, where Fannie Mae is a formidable voice, is also sensitive to the views of Mr. Greenspan. And he, too, recently condemned predatory lending practices.
“‘Although markets have ‘vastly expanded credit to virtually all income classes,’ Mr. Greenspan said in a speech on March 22, he was concerned about ‘abusive lending practices that target specific neighborhoods or vulnerable segments of the population.’
“The Fed has formed a multiagency study group to explore ways to address predatory lending, aides to Mr. Greenspan said.”
In short the report that the Treasury Department co-authored with HUD under Summers leadership was largely repeating warnings that even the arch-deregulators were also making at the same time. He apparently did not view the issue as important enough to draw even minimal press attention to the report.
The article also notes Summers’ role in stifling Brooksley Born’s effort to regulate derivatives as head of the Commodities and Futures Trading Commission. It reports the defense of Summers’ allies:
“But he and his supporters have maintained that the failure occurred because the use of derivatives changed over a decade in ways that they did not anticipate.”
Actually, the idea that derivatives could pose a threat to financial stability should not have been a surprise to sentient beings even in the late 1990s. Alan Greenspan said that he felt it was necessary for the Fed to intervene in the collapse of Long-Term Capital Management in September of 1998 in order to preserve the stability of financial markets. Long-Term Capital had been heavily involved in derivative markets at the time, which should have provided some hint as to ability to create instability for the financial system.
Correction:
The report was actually released in June of 2000, not April. Its release did get an unattributed 6 paragraph story in the New York Times, with no mention of Summers.
Read More Leer más Join the discussion Participa en la discusión
Things are getting hot and heavy as the battle for Fed succession moves into the second half. Earlier this week, the Washington Post’s Fed reporter, Neil Irwin, decided to go head to head with Bette Midler over some unflattering tweets about Larry Summers and his prospects for becoming Fed chair. As a public service, Beat the Press is refereeing the exchange.
Ms Midler led off with the tweet:
“HUH. The architect of bank deregulation, which turned straitlaced banks into casinos and bankers into pimps, may be next Head Fed: Summers.”
Irwin took issue with this by pointing out that the Clinton administration, as well as the Bush administration, were filled with proponents of deregulation. This would be people like Robert Rubin, Alan Greenspan and Timothy Geithner. Based on this background Irwin doesn’t think it’s fair to call Summers “the architect of bank deregulation.”
We at Beat the Press have to call this one mostly for Midler. After all, Summers is known to be a forceful character, not just a shrinking violet who sits in the corner of the room. Regulation fans everywhere remember how Summers denounced Raghuram Rajan as a financial luddite for raising the possibility that deregulation might lead to instability in the financial system at the Fed’s big Greenspanfest in 2005.
Summers was a big actor in pushing the deregulation agenda. He deserves credit for his work. If we change Midler’s tweet to read, “an architect of bank deregulation,” she is 100 percent on the mark.
Next Midler tweeted:
“Larry Summers, Mr. De-Regulation, has never stepped forward to say…”Oops! My bad!” Five years of a world wide recession, and not a peep.”
Irwin doesn’t dispute this one: no apologies from from Summers. We’ll call that a draw.
Then we have Midler tweeting:
“Larry Summers, a HUGE ADVOCATE of higher exec pay and bonuses for execs whose firms received billions in federal bailouts during the crisis.”
Irwin takes serious issue with this one. He assumes that this refers to the scandal around the hundreds of millions paid out in AIG bonuses even as the company was being kept on life support by the taxpayers. Irwin clearly takes Summers’ side here:
“In the wake of outcry over bonuses to AIG employees, for example, Summers said that the admnistration was trying to stop the bonuses but legally couldn’t. ‘Secretary Geithner courageously has gone after these bonuses and will continue to go after these bonuses in a very aggressive way, but we can’t suspend the rule of law and we can’t put the whole economy at risk,’ Summers said in a CNN interview. ‘It is wrong to govern out of anger . . . we can’t let anger stop us from taking the steps that are necessary to maintain the stability of the financial system, keep credit flowing.’ Not quite the same as being a huge advocate.”
We’re not buying Irwin’s line here. First it is not clear that this is Midler’s point of reference. Summers was an advocate of the no questions asked bailout from day one, lobbying the Democratic caucus in September of 2008 to approve the TARP. At that moment, the market was passing judgement on the banks and prepared to send them to the dustbin of history.
If there was to be a bailout Congress could have imposed any terms it liked. Instead, Summers insisted that Congress just give up the money with no real conditions, otherwise we would have a second Great Depression. (Sorry, this is nonsense. The first Great Depression was not caused by a financial crisis alone at its start, but rather a decade of inadequate response. Summers surely knows this.)
Even in the AIG case it is not clear the government could not have forced the bonuses to be taken back. It controlled the flow of money to the company, which it could have ended at any time. Faced with its literal demise, it is likely that the top execs at AIG could have forced substantial reductions in bonuses across the board.
It’s striking that Summers was so concerned about the “rule of law” in this case but seems to show little evidence of concern for the rule of law when it comes to pensions for workers in places like Detroit and Chicago. One could reasonably conclude from his behavior in this and other instances that Summers thinks that high CEO pay and bonuses, even at bailed out companies, is just fine. Beat the Press calls this one for Midler.
So there you have it, Midler wins 2-0-1.
Addendum:
It’s possible that in calling Summers a huge advocate of higher exec pay, Midler was referring to the accounts reported in Ron Suskind’s book, Confidence Men: Wall Street, Washington, and the Education of a President. In this book, Suskind reports accounts of Summers discussing the market as a tool that exposes natural inequality. In other words, he believed that the large gaps in income that we see reflect differences in intelligence and skills.
That is certainly a plausible reference for Midler’s tweet and would provide another reason to score the exchange for Midler.
Read More Leer más Join the discussion Participa en la discusión


