


The wealthy countries of the world have spent the last three and half years falling off a 90 percent debt-to-GDP growth cliff that we should now all be able to agree does not exist. While I am happy to see that economists have been able to demonstrate conclusively that the world is not flat, I will just quickly explain again why I always knew this fact.
As I have explained numerous times, in addition to debt, governments also have assets. In fact, governments routinely sell assets, not just out of ideological or corruption driven privatization drives, but in the normal course of events they will have occasion to sell off items like land, unneeded office space, portions of the broadcast spectrum, etc.
If there were some serious growth penalty associated with certain debt levels then it would imply that selling off assets would give an above market return. Not only would the government get the market price for whatever asset it was selling, but it would also lead to a growth premium as a result of pushing its debt lower. In the case of the Reinhart-Rogoff cliff story, this premium would be enormous since we could envision raising growth by a full percentage point by selling enough assets to lower our debt-to-GDP ratio from 95 percent to 85 percent (roughly $1.6 trillion in assets).
We don’t typically see governments selling assets for this reason. This would suggest that either governments were very dumb for not taking advantage of an easy way to boost growth or that debt does not have the negative impact on growth that was advertised.
While there are plenty of politicians who are to lunch when it comes to economic policy, this struck me as too out to lunch to be believed. For this reason, I could never be a believer in the Reinhart-Rogoff debt cliff even before other economists were able to show that the relationship did not exist.
Read More Leer más Join the discussion Participa en la discusión
Ok folks, this one is a little nerdy, but there are some important issues here. In the last year or so the Bureau of Economic Analysis’ measure of national income growth has exceeded its measure of GDP growth. This has led some analysts to jump on the income numbers and say that the economy is actually growing somewhat more rapidly than the GDP measures that were routinely follow, which are measured on the output side.
Just to backtrack for a moment, in principle we should be able to measure GDP on either the income side or the output side and come up with the same number. The income side means that we add up all the incomes generated in production: wages, interest, profits, rents, etc. On the output side we would be measuring the value of all the goods and services produced over the course of a quarter or year. If we had perfect measurements of the economy then the two should end up being the same.
As a practical matter they never are the same. Most often the output side is somewhat higher (@ 0.5 percent) than the income side. The conventional wisdom is that income is more poorly measured because people have a reason to lie about their income (i.e. taxes). So economists have traditionally looked at the output side as the better measure of growth.
While the output side has historically shown a somewhat higher measure of GDP, there have been some exceptions to this, most notably in the late 1990s and the peak of the last business cycle. These were both periods in which there were large amounts of capital gains generated by bubbles in the stock market in the 1990s and housing market in the last decade.
While capital gains are not supposed to count as income for GDP purposes, it is almost certain that some do. (Short-term capital gains are taxed the same way as normal income, so there is no reason for people to distinguish between capital gains and normal income on tax forms.) Anyhow, if we hypothesize that some amount of capital gains end up being counted as normal income then any time we have more capital gains in the economy we would expect that the income side measure of GDP would rise relative to the output side measure.
David Rosnick and I tested this view a couple years back, measuring the extent to which the statistical discrepancy (the gap between the output measurement and income measurement of GDP) fluctuated in response to recent trends in capital gains. And, we got a very solid fit. So we were not surprised when the recent run-up in the stock market, coupled with a recovery in the housing market, caused income growth to again exceed output growth. But hey, there can be lots of good jobs struggling over this one.
Anyhow, this matters both for the answer to the question as to how fast the economy is growing, but also how we view savings. Savings are defined as the difference between income and consumption. If capital gains are showing up as income, then we are overstating income and therefore overstating savings. We think this was very likely the case at the peaks of both the stock and housing bubbles, which means that the consumption driven by these bubbles was even larger than the conventional data show.
Note: Typos corrected — thanks Joe and Medgeek.
Read More Leer más Join the discussion Participa en la discusión
Paul Krugman commented on the dubious claim that Ireland’s economy is recovering. He noted that its GDP is still well below its pre-crisis level. While this is true, the employment to population (EPOP) ratio might give a better sense of how most people in Ireland might view the situation.
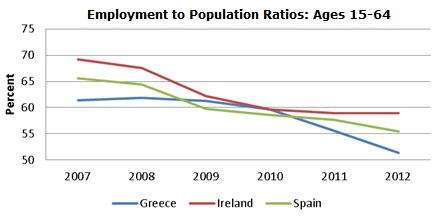
Source: OECD.
Through the end of last year Ireland had actually seen a slightly sharper fall in its EPOP than Greece and Spain, the two countries hardest hit by the troika’s austerity agenda. Ireland’s EPOP had stabilized by 2011 while the EPOPs in Greece and Spain were headed sharply lower, but it is hard to see much of a recovery story here. At the end of 2012 the EPOP in Ireland was still down more than 10 percentage points from its pre-recession level. That doesn’t look like much of a success story.
Paul Krugman commented on the dubious claim that Ireland’s economy is recovering. He noted that its GDP is still well below its pre-crisis level. While this is true, the employment to population (EPOP) ratio might give a better sense of how most people in Ireland might view the situation.
Source: OECD.
Through the end of last year Ireland had actually seen a slightly sharper fall in its EPOP than Greece and Spain, the two countries hardest hit by the troika’s austerity agenda. Ireland’s EPOP had stabilized by 2011 while the EPOPs in Greece and Spain were headed sharply lower, but it is hard to see much of a recovery story here. At the end of 2012 the EPOP in Ireland was still down more than 10 percentage points from its pre-recession level. That doesn’t look like much of a success story.
Read More Leer más Join the discussion Participa en la discusión
The media have largely accepted at face value the claims from Chicago Mayor Rahm Emanuel that is necessary to close a large number of the city’s schools in order to save money and improve the quality of education. It turns out that much of what Emanuel has claimed about savings and moving students to better schools is not supported by the evidence as Chicago radio station WBEZ uncovered in its analysis.
One might think that this sort of follow-up would get more attention from the national media not only because Rahm Emanuel was formerly President Obama’s chief of staff, but also because its school commissioner for 8 years was Arne Duncan, the current education secretary. Emanuel’s claims that the schools are a disaster would seem to be an indictment of Mr. Duncan’s performance. (Several of the schools slated for closing were success stories highlighted by Duncan.)
The Post deserves credit on this one. Its education reporter Valerie Strauss did her homework.
Read More Leer más Join the discussion Participa en la discusión
I wish I could take credit for making this one up.
I wish I could take credit for making this one up.
Read More Leer más Join the discussion Participa en la discusión
Read More Leer más Join the discussion Participa en la discusión
Okay, that’s not exactly what he did, but he did devote a NYT column to tell readers about the business started by his daughter’s college roommate. He claimed that this business shows how the labor market is changing. He produced literally no evidence whatsoever to support this claim.
The article tells readers:
“Underneath the huge drop in demand that drove unemployment up to 9 percent during the recession, there’s been an important shift in the education-to-work model in America. Anyone who’s been looking for a job knows what I mean. It is best summed up by the mantra from the Harvard education expert Tony Wagner that the world doesn’t care anymore what you know; all it cares ‘is what you can do with what you know.'”
And we know about the big changes in the labor market because of the start-up started by the roommate of Thomas Friedman’s daughter that is designed to test workers to match them for jobs. According to Friedman, the company has about 50,000 registered job-seekers. He also tells us that they receive an average of 500 applications for every job opening. If we assume that job-seekers submit an average of 100 to 200 applications then this start-up would have between 10,000 and 20,000 job listings.
According to the Labor Department there are over 4.2 million hires every month or roughly 50 million over the course of a year. That means that this start-up’s listing account for somewhere between 0.02 percent and 0.04 percent of job openings. Perhaps we should wait a little while before declaring that the shape of the labor has changed.
Read More Leer más Join the discussion Participa en la discusión
I have had several people send me this George Packer article in the New Yorker on the political and social attitudes of the Silicon Valley millionaires and billionaires. While the piece makes for entertaining reading, it is difficult to see it as any great expose.
The piece basically shows that Silicon Valley fast lane is filled with self-absorbed twits who don’t have a clue about what the rest of the country looks like. So?
Seriously, who did we think was making big bucks in high tech, great philanthropists? As a general rule it is reasonable to assume that people who make lots of money in any industry, whether it finance, manufacturing, entertainment, or anything else, are primarily concerned with making money in that industry. I don’t know whether we should blame them for that fact, but we certainly should blame policy types who then imagine that these people’s success at money making gives them great insight into how we should run society.
Bill Gates got incredibly rich because he has sharp elbows and perhaps was willing to bend the law more than his competitors. The same applies to Mark Zuckerberg. That doesn’t mean that both are not smart and hard working people, but it does mean that they may not be the best people to determine our education policy or how best to lift the world’s poor out of poverty. Their money may give them considerable voice in these areas, but there is no reason to assume that their insights are any better than those of the latest Powerball winner.
Read More Leer más Join the discussion Participa en la discusión
Read More Leer más Join the discussion Participa en la discusión
Since folks seem to have difficulty understanding how assets can be relevant to the Reinhart-Rogoff debt kills growth story, I will give a concrete example. Brad Plumer had a piece this weekend in the Post that discussed the potential of a carbon tax to slow greenhouse gas emissions and raise revenue. He presents estimates that a $20 a ton tax would raise $1.2 trillion over the next decade.
Okay, at this point everyone should have heard of the idea of selling emissions permits as being roughly equivalent to a tax in terms of raising revenue and discouraging emissions. Suppose that we decided tomorrow to auction off permits that were issued in a number that was intended for carbon to be priced at $20 a ton. This should raise $1.2 trillion for the government, an amount equal to 7.5 percent of GDP. (I’m ignoring discounting to keep this simple, I’m trying to make a point. If we need more money we can make the permits good for 20 years.)
If we had crossed the Reinhart-Rogoff danger line of 90 percent, say with a debt-to-GDP ratio of 95 percent, this sale of permits would push us safely under the threshold with a debt-to-GDP ratio of 87.5 percent. If the Reinhart-Rogoff 90 percent cliff was real, how could anyone be opposed to this policy?
It would increase annual growth by something like 1.0 percentage point, while helping to save the planet. The cumulative gain to GDP would be somewhere in the neighborhood of $8 trillion or more than $100,000 in additional output for an average family of four.
The United States has many other carbon permit sale option type policies available. If we believed in the Reinhart-Rogoff cliff, these would be the obvious answer as these asset sales would provide incredible growth dividends.
I’m not personally advocating such asset sales because I don’t take the Reinhart-Rogoff cliff seriously. But any honest economist who does believe in the RR cliff should be highly vocal proponents of asset sales. (They are much easier politically than cutting Social Security and Medicare.)
So here’s the perfect lie detector test for economists arguing the RR case. Are they pushing large scale asset sales?
Read More Leer más Join the discussion Participa en la discusión


