


Read More Leer más Join the discussion Participa en la discusión
The median pay for a member of the board of a Fortune 500 company is almost $240,000 a year. This typically involves 4-8 meetings a year. One of the top priorities of the board is supposed to be ensuring that top management doesn’t rip off the company. They have not been doing a very good job as Gretchen Morgenson points out in her column today.
That raises the question of what exactly they get all this money for? Director Watch will be coming soon to a website near you.
Read More Leer más Join the discussion Participa en la discusión
Floyd Norris has a good piece today comparing trends in unemployment rates across countries in the downturn. He notes that Germany alone has seen a drop in its unemployment rate since the downturn began. While he notes that Germany has pursued work sharing policies that have encouraged employers to keep workers on the job working shorter hours, readers may not appreciate the full importance of this policy.
Growth in Germany and the United States have been virtually identical since the beginning of the downturn. While Germany has a large balance of trade surplus, in contrast to the deficit in the United States, its consumption growth has been weaker.
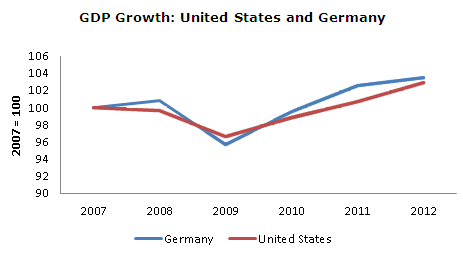
Source: International Monetary Fund.
Germany is helped in this story by the fact that it has a slower rate of labor force growth, but clearly the difference in growth rates does not explain the fact Germany’s unemployment rate has fallen by 2.5 percentage points while unemployment in the United States has risen by 3.0 percentage points.
Note: correction made –thanks ltr.
Floyd Norris has a good piece today comparing trends in unemployment rates across countries in the downturn. He notes that Germany alone has seen a drop in its unemployment rate since the downturn began. While he notes that Germany has pursued work sharing policies that have encouraged employers to keep workers on the job working shorter hours, readers may not appreciate the full importance of this policy.
Growth in Germany and the United States have been virtually identical since the beginning of the downturn. While Germany has a large balance of trade surplus, in contrast to the deficit in the United States, its consumption growth has been weaker.
Source: International Monetary Fund.
Germany is helped in this story by the fact that it has a slower rate of labor force growth, but clearly the difference in growth rates does not explain the fact Germany’s unemployment rate has fallen by 2.5 percentage points while unemployment in the United States has risen by 3.0 percentage points.
Note: correction made –thanks ltr.
Read More Leer más Join the discussion Participa en la discusión
Read More Leer más Join the discussion Participa en la discusión
Read More Leer más Join the discussion Participa en la discusión
Folks have been asking me about a new study showing a strong link between homeownership and unemployment. The study finds a long-term of elasticity of the unemployment rate with respect to homeownership close to 1. This means that if the homeownership rate in a state doubles then we should expect its unemployment rate to double. For the country as a whole, since the homeownership rate has risen by roughly 20 percent from its 1950 level we should expect the unemployment rate to be roughly 20 percent higher, after controlling for other factors.
These are striking results, but even as a critic of the cult of homeownership, I am not buying. The paper does include many tests for robustness, so there is no simple story of cherry-picking the data. But there are important questions of reverse causation. Suppose that states have weak economies so that many people leave for states with more job opportunities.
In this story the state losing people is likely to have a higher homeownership rate (homeowners are less likely to move) and the state getting people is likely to have a lower homeownership rate since the new arrivals are less likely to be homeowners. The study tries to control for this issue by having lags of up to 5 years, but it is certainly possible that trends in economic growth and stagnation are longer than this. It might have been useful to try lags of 10 years.
It is also striking that the states with the largest increase in homeownership are all in the south. If there was a rise in unemployment in these states was this a regional effect or due to homeownership? Including a regional variable might be helpful to see how it affects the results. In the same vein, immigrants are likely to be associated with both a lower unemployment rate (immigrants go to areas with jobs) and a lower rate of homeownership (recent immigrants don’t own homes). I may have missed it, but it doesn’t look like immigrant status is one of the control variables in the regressions.
One finding that may have a simple explanation is their finding that in the years 2000-2010 there was a strong tie between commute times and homeownership. I’ll be a bit of a cynic here. Areas like Los Vegas and Phoenix were booming in the bubble years, these states saw substantial increases in homeownership. This was probably associated with an increase in commute times. The bust and drop in homeownership was especially pronounced in these areas. My guess is that they also saw a drop in average commute times. I don’t know if this is really the story, but at first glance that would be my guess.
Anyhow, I can believe that homeownership has some negative impact on employment. There is the story of reducing mobility. This can be exaggerated (people do rent out homes and couples separate for work), but surely it is not zero. Also, policies that favor homeownership, like the mortgage interest deduction, undoubtedly pull capital away from productive investment. However, the relationships found in this paper seem too large to be plausible.
So chalk me up as a skeptic on this one, but it is an interesting paper that deserves serious consideration.
Note:
It is interesting to see that the union density variable in these regressions is always negative and sometimes significant. This would suggest that higher union density is associated with lower unemployment rates. Much as I might like to say this is the case, my guess is that something else is at work.
States like Michigan and Ohio saw the percentage of workers in unions fall at the same time they lost hundreds of thousands of jobs in the auto and related industries. This could give the sort of correlation found in these regressions. This is the same sort of reverse causation that I suspect we see with homeownership and unemployment rates.
Further Note:
Danny Blanchflower, a co-author of the paper, notified me that he ran a regression that included a variable for the southern states to pick up any regional effect. He said that this actually made the results stronger, so clearly their findings are not driven by some peculiarity of the south that led to both higher rates of homeownership and higher rates of unemployment in the region.
Read More Leer más Join the discussion Participa en la discusión
The Washington Post continued to use its news section to advance its agenda for cutting Social Security and Medicare. It headlined an AP article on how these programs have not been cut by the sequester, “entitlement programs thrive amid gridlock, shifting money from younger generations to older.”
The headline and the article wrongly imply that cuts to programs will benefit the young and increase economic growth. This is not true. The proximate cause for these cuts is a decision by political leaders to have lower budget deficits. The headline would have more accurately read “pursuit of deficit reduction is taking away money from young.”
The notion of a shift to older generations is especially bizarre because none of the programs benefiting the elderly have been expanded notably in recent years. (The Medicare drug benefit is being made more generous, but the cost is covered by reduced payments to drug companies.) The assertion of a redistribution to the elderly would be like claiming there has been a redistribution to people living in North after reporting on a crop failure in the South. Certainly the fact that the South is worse off means that the North is relatively better off, but to describe this as a redistribution to the North is highly misleading, as is the claim of a redistribution to the elderly.
Also, even within whatever deficit targets are set one could just as credibly say that there has been a redistribution from children to Wall Street banks since the Wall Street banks are using their political power to block any effort to tax their financial speculation. Such a tax could easily cover the cost of the programs that are now being cut. The Post has decided not to frame the issue this way.
Read More Leer más Join the discussion Participa en la discusión
Businessweek tells us that homebuilders would be building more homes, if only they could find qualified construction workers. Hmmm, that must mean that wages for construction workers are soaring as the shortage causes employers to bid up wages in an effort to grab workers away from competitors or hold on to their current workforce.
That’s not what the data say. According to data from the Bureau of Labor Statistics, after adjusting for inflation the average hourly wage in construction has risen by just 0.9 percent in the five years from 2007 to 2012. Note that this a total increase of 0.9 percent over these five years, not an annual increase. If there is a labor shortage, it’s not showing up in wages for some reason. (Of course the unemployment rate for construction workers was reported at 13.2 percent in April, which also does not seem to indicate a labor shortage.)
The more obvious explanation for the fact that construction remains depressed is the near record vacancy rates. Presumably many of these empty homes will have to be filled before builders get more aggressive about building new ones.
Read More Leer más Join the discussion Participa en la discusión
Read More Leer más Join the discussion Participa en la discusión
That is what readers of a front page Washington Post news story on the budget must be asking. The piece notes the sharp decline in the budget deficit, then tells readers:
“That might seem like good news, but it is unraveling Republican plans to force a budget deal before Congress takes its August break (emphasis added).”
It’s not obvious why the piece would use “but” in this sentence as opposed to “and.” Obviously the Post considers it bad news that the Republican strategy is unraveling. Most papers would leave such comments for the opinion pages.
The piece later adds that the lower deficits are reducing pressure on Democrats to consider:
“far-reaching changes to Medicare and the U.S. tax code that Republicans see as fundamental building blocks of a deal.”
The use of “changes” is misleading. The Republicans have advocated cuts in Medicare compared with baseline levels of spending. It is understandable that the Republicans would prefer a euphemism, but the Post should be trying to inform its readers.
Also, the Post does not know what Republicans actually “see” as fundamental to a deal. It only knows what they say they view as being fundamental. Politicians sometimes don’t say what they really believe.
It is also striking that this piece makes no reference to recent developments in economics that have seriously undermined the case for deficit reduction. Readers of this piece would believe that budget policy is unaffected by economic considerations. That may be true, but it would be worth highlighting this fact. Most readers probably would be interesting in knowing that members of Congress apparently only care about budget targets and do not give a damn about growth and jobs.
Read More Leer más Join the discussion Participa en la discusión


