


The Washington Post told readers:
“both sides agree that as a principle, keeping tax rates low while eliminating deductions is better than increasing tax rates.”
While this is true as a general principle, the preference for lower rates is considerably more complex than the statement implies. In almost any scenario of trading off lower rates for fewer deductions, the very wealthy end up ahead. Not everyone views this as desirable.
Also, the limiting of deductions is likely to pose problems for higher tax states, which could effectively count on the federal government to provide somewhat of a subsidy by lessening the impact of state and local taxes on high income taxpayers. In addition, one of the largest deductions is for charitable contributions. There is not agreement that limiting this deduction would be an appropriate trade off for lower tax rates.
Read More Leer más Join the discussion Participa en la discusión
That is the implication of his column decrying the falling birthrate in the United States and other wealthy countries . Douthat seems to believe that we face some terrible fate if the population of the United States stagnates or even declines.
People who follow the news probably would see things differently. Given the urgent need to reduce greenhouse gas emissions to slow global warming, the prospect of a smaller population should be seen as a huge bonanza. The story is quite simple, if we have 20 percent fewer people, we should expect our emissions of greenhouse gases to be roughly 20 percent less. Since the U.S. ranks near the top in terms of emissions per person, slower U.S. population growth is especially important to the world.
While some have made a big deal out of the projected decline in the ratio of workers to retiree, those familair with arithmetic know that the impact of even low rates of productivity growth swamps the impact of a lower ratio of workers to retirees.
Source: Author’s calculations.
It is unfortunate if financial insecurity discourages people who want children from having them, but from the standpoint of economy and the country, a smaller population should be seen as good news.
Read More Leer más Join the discussion Participa en la discusión
For some reason media fact checkers get especially irate by political figures when they make the entirely true claim that Social Security does not contribute to the budget deficit (e.g. here and here). The Post’s Glenn Kessler gives a comparatively thoughtful comment in his Post column, but still comes down on the side of the adds to the deficit folks. The bottom line for Kessler is that Social Security is using interest on the government bonds it holds to pay for benefits.
This is true, but lots of people use interest on government bonds to pay for things. For example, if Peter Peterson used $5 million in interest on government bonds he held to finance the start up of his Campaign to Fix the Debt would it be accurate to say that he had contributed to the deficit? I suspect that most of the facto checkers would say that it is not.
Under the law, the trust fund is supposed to be treated as a bondholder like any other bondholder. This meant, for example, that the $2.7 trillion in debt held by the Social Security trust fund was included as part of the debt covered by the ceiling when the deadlock over its increase brought the country to the brink of default in the summer of 2011.
If we view the bonds held by the trust fund as they are defined in law, then it makes no more sense to say that spending the interest or principal from these bonds contributes to the deficit than the spending of interest or principal by any other bondholder. Since this money is already owed by the government to the trust fund, spending from the trust fund simply changes the identity of the owner of the debt, just as if Peterson were to sell his bonds to someone else. People may not like the law governing the trust funds, but that does not make someone wrong for talking about Social Security and its trust fund as they are defined under the law.
There is another point that deserves attention in Kessler’s piece. At one point he praises Senator Dick Durbin (the perp whose comment provided the basis for the piece) for having:
“acknowledged that Social Security’s long-term financing is an important issue that cannot be deferred.”
This implies that it is necessary to deal with Social Security’s financing now. That claim is clearly false. If we waited a decade before taking any action, the projections from the Social Security trustees indicate that the program could be kept fully solvent through the rest of the century by phasing in tax increases and benefit cuts comparable to those put in place by the Greenspan commission in 1983. While many people may want the country to deal with Social Security’s long-term financing problems now, there certainly is no reason that the issue cannot be deferred.
And there are good arguments as to why deferring major decisions might be desirable. For example, thanks to the efforts of the Peterson types and the overall poor state of media reporting on the issue, polls consistently show that the vast majority of young people believe that they will not see their Social Security checks when they retire. This is a completely false belief according to all current projections, howver it is likely to color their attitudes towards changes in the program. It would be desirable to have any major reworking of the program carried through in an environment in which the public was better informed about the true state of the program’s finances.
Another important fact arguing for delay is that the Social Security trustees project that real wages will grow by more than 20 percent over the next decade. This contrasts to three decades in which most workers have seen almost no wage growth. If the trustees projections prove accurate then the public might be much more inclined to tax away some of their future wage growth to support higher benefits than would be the case at present.
Whether or not one agrees with these reasons for delaying action on the program, it is simply wrong to assert that action cannot be deferred. This is simply a judgement that it is better to not defer action, not a statement of fact.
Read More Leer más Join the discussion Participa en la discusión
A NYT editorial today argued that helping out underwater homeowners is essential to the recovery. This does not make any sense as can be seen with simple arithmetic.
There are roughly 11 million underwater homeowners. Suppose that eliminatiing all of their underwater debt caused them to increase spending by an average of $10,000 per family per year. This would be a very substantial increase in spending for a group that has a median income of close to $70,000. Depending on the whether we use the Core Logic estimate of underwater equity ($700 billion) or the Zillow estimate ($1.1 trillion), it would imply a wealth effect of between 10 and 15 cents on the dollar, which is roughly 2-3 times conventional estimates of the wealth effect.
Even in this case, the increase in spending would still come to just $110 billion a year. Assuming a multiplier on this spending of 1.5 that get us to $165 billion in additional output or a bit more than one-sixth of the gap between potential and actual GDP. That’s helpful, but far from getting us back to full employment. And given that the actual impact is more likely to be about half of this size, it’s pretty hard to come up with a story where underwater homeowners provide the key to recovery.
In fact, consumers are spending at an unusually high rate relative to their disposable income. It is just lower than during the consumption boom years at the peak of the housing bubble.
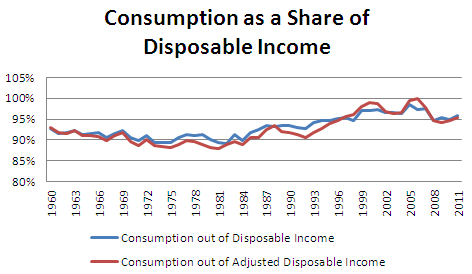
Source: Bureau of Economic Aanlysis.
There are still good reasons for helping underwater homeowners, as I’ve long argued. But this is not what is holding back the recovery.
A NYT editorial today argued that helping out underwater homeowners is essential to the recovery. This does not make any sense as can be seen with simple arithmetic.
There are roughly 11 million underwater homeowners. Suppose that eliminatiing all of their underwater debt caused them to increase spending by an average of $10,000 per family per year. This would be a very substantial increase in spending for a group that has a median income of close to $70,000. Depending on the whether we use the Core Logic estimate of underwater equity ($700 billion) or the Zillow estimate ($1.1 trillion), it would imply a wealth effect of between 10 and 15 cents on the dollar, which is roughly 2-3 times conventional estimates of the wealth effect.
Even in this case, the increase in spending would still come to just $110 billion a year. Assuming a multiplier on this spending of 1.5 that get us to $165 billion in additional output or a bit more than one-sixth of the gap between potential and actual GDP. That’s helpful, but far from getting us back to full employment. And given that the actual impact is more likely to be about half of this size, it’s pretty hard to come up with a story where underwater homeowners provide the key to recovery.
In fact, consumers are spending at an unusually high rate relative to their disposable income. It is just lower than during the consumption boom years at the peak of the housing bubble.
Source: Bureau of Economic Aanlysis.
There are still good reasons for helping underwater homeowners, as I’ve long argued. But this is not what is holding back the recovery.
Read More Leer más Join the discussion Participa en la discusión
The Washington Post was so upset over President Obama’s latest budget proposal to Republican congressional leaders that it used a front page editorial to complain to readers. While the article included several comments from Republicans warning of the dangers of President Obama’s not yielding to their demands. It added the additional assertion that the deadlock is occurring:
“with time running out for policymakers to agree on a plan to prevent more than $500 billion in tax increases and spending cuts that could rattle the economy.”
This statement grossly misrepresents the reality, since the time will run out “to prevent more than $500 billion in tax increases and spending cuts” more than a year from now. We don’t see all of these tax increases and spending cuts on January 1, as the article would lead readers to believe. They would only take place over the course of a full year if Congress and President Obama never reached a deal. For this reason, there is not much reason for concern that the failure to reach a deal by January 1 “could rattle the economy.”
The article also asserted, with no supporting evidence, that:
“simply canceling the changes [the tax increases and spending cuts scheduled for January 1], however, risks undermining confidence in the nation’s ability to manage its rising debt.”
If the paper has evidence for this claim then it should have presented it. The low interest rates on U.S. government debt suggests that the financial markets are not very concerned about the nation’s ability to manage its rising debt.
The piece also complains about President Obama’s plan to change the structure under which Congress approves the debt ceiling so that it would require a two-thirds vote to prevent the ceiling from being increased. It told readers:
“this change would also deprive Congress of its historic authority over federal borrowing.”
Actually Congress would continue to have complete authority over federal borrowing. It can either appropriate less spending or impose more taxes, just as was always the case. The change in rules on the debt ceiling really has more to do with Congress’s ability to default on its commitments, since the issue with the debt ceiling is whether the country will pay the bills that Congress has opted to run up. No other country in the world has this sort of restriction on debt.
Read More Leer más Join the discussion Participa en la discusión
According to USA Today, he did. USA Today’s editors are hopping mad because people like Senator Dick Durbin keep reminding them of the law which says that Social Security cannot contribute to the deficit.
Under the law, the Social Security program is financed exclusively by its own payroll tax. (The exception is the last two years where general revenue was added to make up for the revenue lost as a result of the payroll tax holiday.) It can only spend money raised through this tax either in the current year or from the interest and principal from government bonds purchased in prior years.
This means that Social Security can never add to the deficit, except in the same way that Peter Peterson sells his government bonds. When Peterson sells his bonds, the government must either cut spending, raise taxes or borrow the money from someone else. Since the actors in financial markets are more realistic than the frantic Washington types who are working themselves into hysterics about the deficit, the government will have no problem borrowing from someone else either when Peter Peterson sells his bonds or Social Security cashes in some of its bonds.
Anyhow, give USA Today and the other deficit fear mongers a gigantic “F” for flunking reading comprehension. Unless Congress changes the law, Social Security cannot contribute to the deficit, got it boys and girls?
btw, USA Today also has another bizarre invention in this editorial. It tells readers:
“From 1983 through 2009, Social Security collected more in taxes than it paid in benefits. The surpluses were supposed to go into the trust fund, protected by what Al Gore called a “lockbox” when he ran for president in 2000. Alas, there is no lockbox and never has been; the money came into the Treasury and went out just as quickly, spent on the government’s day-to-day expenses and replaced by IOUs in a file cabinet.”
Huh? What on earth is the paper talking about? The surplus did go into the trust fund, buying U.S. government bonds, which the paper bizarrely calls IOUs. This is exactly what the law required. It’s not clear where USA Today thinks government bonds should be kept, but apparently not in a filing cabinet.
Anyhow Al Gore did have a specific proposal for the treatment of the surplus. It’s not clear that he would have implemented it if elected (it would have meant running large budget surpluses even as the U.S. economy sank into recession in 2001. That is unconscionably stupid economic policy), but it certainly is not what is required under the law, even if folks at USA Today really liked it.
I’m going off to see what the yield is on GE and Verizon IOUs.
Addendum:
Sorry folks, I didn’t mean to be overly obscure on the Peterson selling his bonds reference. He could have bonds that actually come due that he will cash in and the Treasury would have to roll over this debt, as it does all the time, as some folks have pointed out. But I was actually thinking of the more typical case where he dumps $30 million of bonds in the market. In that case, Peterson was the person who was originally lending money to the U.S. government, but then another person (the buyer) will then be holding the loan. That is what I meant that we would need someone else to borrow from. Of course on the bonds he holds Peterson is obviously the person at risk (he needs to find someone), but as a practical matter, since we are issuing new bonds all the time, it has the same effect on the market if Peterson dumps his $30 million as if the government has to issue another $30 million in new bonds.
Read More Leer más Join the discussion Participa en la discusión
Yes, things are really dire. Readers of the NYT, Washington Post and other major news outlets have been treated to large numbers of stories in recent months telling us that technology is going to make large segments of our workforce obsolete. According to these stories millions, or even tens of millions, of people will be unable to find jobs in the economy of the future.
But wait, it’s getting even worse. Not only are we not going to have enough jobs, the Post now tells us that we will not have enough people. It reports on a new study showing that the United States had the lowest birth rate since 1920 last year. The article tells us:
“The decline could have far-reaching implications for U.S. economic and social policy. A continuing decline would challenge long-held assumptions that births to immigrants will help maintain the U.S. population and provide the taxpaying work force needed to support the aging baby boomer generation.”
So there you have it, not only will we not have enough jobs, the Post is telling us that we won’t have enough people. It can’t get much worse than that!
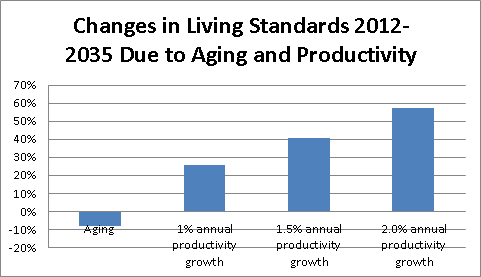
This shows us the level of seriousness of Washington policy debates. We are supposed to be simultaneously terrified by diametrically opposite problems. To make this as clear as possible, just in case any Washington Post editors are reading, if we have a shortage of labor due to a slow growing or even declining population, then we don’t have to worry about large numbers of workers being unable to find jobs. There will be a labor shortage. This implies rapidly rising wages and employers who are willing to provide whatever training workers need to do the jobs available.
This means that at least one of the grave problems currently being pushed by the Serious People does not exist. A little arithmetic (a skill in short supply in policy circles) should make it clear that inadequate population growth is not going to be a dire problem. The figure below compares the impact on workers’ living standards of the projected increase in the ratio of workers to retirees over the next twenty three years with various rates of productivity growth. (You can find the explanation for the calculation here.)
Source: Author’s calculations.
The basic story is that even a 1.0 percent rate of productivity growth (the slowest we’ve seen in the post-War period) swamps the impact of demographics on living standards. Of course if technology is going to displace huge numbers of workers, as we’re being told, then we will see much more rapid productivity growth so the relative impact of demographics will be even less important.
In short the demographic scare story is sheer silliness. It is of course unfortunate if people who would like children feel that they are too financially insecure to have them, but the idea that we should be troubled by a less crowded, less polluted country? As they say in our nation’s capitol, only in the Washington Post.
Yes, things are really dire. Readers of the NYT, Washington Post and other major news outlets have been treated to large numbers of stories in recent months telling us that technology is going to make large segments of our workforce obsolete. According to these stories millions, or even tens of millions, of people will be unable to find jobs in the economy of the future.
But wait, it’s getting even worse. Not only are we not going to have enough jobs, the Post now tells us that we will not have enough people. It reports on a new study showing that the United States had the lowest birth rate since 1920 last year. The article tells us:
“The decline could have far-reaching implications for U.S. economic and social policy. A continuing decline would challenge long-held assumptions that births to immigrants will help maintain the U.S. population and provide the taxpaying work force needed to support the aging baby boomer generation.”
So there you have it, not only will we not have enough jobs, the Post is telling us that we won’t have enough people. It can’t get much worse than that!
This shows us the level of seriousness of Washington policy debates. We are supposed to be simultaneously terrified by diametrically opposite problems. To make this as clear as possible, just in case any Washington Post editors are reading, if we have a shortage of labor due to a slow growing or even declining population, then we don’t have to worry about large numbers of workers being unable to find jobs. There will be a labor shortage. This implies rapidly rising wages and employers who are willing to provide whatever training workers need to do the jobs available.
This means that at least one of the grave problems currently being pushed by the Serious People does not exist. A little arithmetic (a skill in short supply in policy circles) should make it clear that inadequate population growth is not going to be a dire problem. The figure below compares the impact on workers’ living standards of the projected increase in the ratio of workers to retirees over the next twenty three years with various rates of productivity growth. (You can find the explanation for the calculation here.)
Source: Author’s calculations.
The basic story is that even a 1.0 percent rate of productivity growth (the slowest we’ve seen in the post-War period) swamps the impact of demographics on living standards. Of course if technology is going to displace huge numbers of workers, as we’re being told, then we will see much more rapid productivity growth so the relative impact of demographics will be even less important.
In short the demographic scare story is sheer silliness. It is of course unfortunate if people who would like children feel that they are too financially insecure to have them, but the idea that we should be troubled by a less crowded, less polluted country? As they say in our nation’s capitol, only in the Washington Post.
Read More Leer más Join the discussion Participa en la discusión
The major media outlets did their best to ignore the housing bubble as it was growing to ever more dangerous levels. Incredibly, they still cannot recognize and understand the bubble even after its collapse sank the economy. Hence we get the Washington Post offering us 10 charts that explain “what is holding back the economy.”
Of course the Washington Post is a large corporation so they can waste money on unnecessary and misleading charts. Since CEPR is a small not-for-profit, we explain it all in one chart.
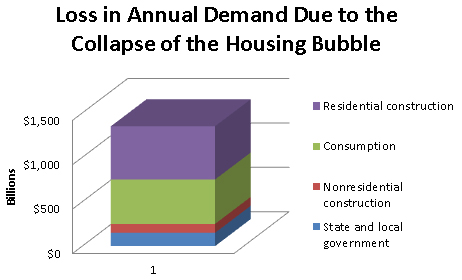
Source: Author’s calculations.
The basic story remains as simple as can possible be. We had a huge building boom that went bust. Instead of building houses at a near record pace, construction fell back to the lowest level in 50 years due to enormous oversupply. Similarly, the consumption boom that was driven by $8 trillion in bubble generated housing equity faded when that wealth disappeared.
The Post piece holds out the hope that underwater homeowners will increase annual consumption by $400-$500 billion when they get above water. That would imply around $40,000 a year in additional consumption from families with a median income of around $70,000. This is not the sort of stuff that deserves to be taken seriously. It’s also important to remember that the ratio of consumption to disposable income is unusually high, not low.
The other items on my chart are the falloff in non-residential construction following the collapse of the bubble in that sector and the drop-off in state and local government spending that resulted from the loss of property taxes and other revenue following the collapse of the bubble.
This single chart very simply tells the story of the housing bubble. If the Post needs make work projects they can always have people make up charts for no reason, but it would be better if they didn’t include them in the newspaper. It might confuse readers.
The major media outlets did their best to ignore the housing bubble as it was growing to ever more dangerous levels. Incredibly, they still cannot recognize and understand the bubble even after its collapse sank the economy. Hence we get the Washington Post offering us 10 charts that explain “what is holding back the economy.”
Of course the Washington Post is a large corporation so they can waste money on unnecessary and misleading charts. Since CEPR is a small not-for-profit, we explain it all in one chart.
Source: Author’s calculations.
The basic story remains as simple as can possible be. We had a huge building boom that went bust. Instead of building houses at a near record pace, construction fell back to the lowest level in 50 years due to enormous oversupply. Similarly, the consumption boom that was driven by $8 trillion in bubble generated housing equity faded when that wealth disappeared.
The Post piece holds out the hope that underwater homeowners will increase annual consumption by $400-$500 billion when they get above water. That would imply around $40,000 a year in additional consumption from families with a median income of around $70,000. This is not the sort of stuff that deserves to be taken seriously. It’s also important to remember that the ratio of consumption to disposable income is unusually high, not low.
The other items on my chart are the falloff in non-residential construction following the collapse of the bubble in that sector and the drop-off in state and local government spending that resulted from the loss of property taxes and other revenue following the collapse of the bubble.
This single chart very simply tells the story of the housing bubble. If the Post needs make work projects they can always have people make up charts for no reason, but it would be better if they didn’t include them in the newspaper. It might confuse readers.
Read More Leer más Join the discussion Participa en la discusión
David Cay Johnston has a nice column in the NYT discussing how a failure of antitrust regulation has effectively allowed the old ATT monopoly to recreate itself as a duopoly, although this time without regulation.
David Cay Johnston has a nice column in the NYT discussing how a failure of antitrust regulation has effectively allowed the old ATT monopoly to recreate itself as a duopoly, although this time without regulation.
Read More Leer más Join the discussion Participa en la discusión
NAFTA may not have done much to improve Mexico’s growth rate, but its approval sure did wonders for U.S. reporting on Mexico’s economy. The Washington Post in particular has run several pieces touting Mexico’s booming economy and rising middle class (e.g here and here). In fact, a 2007 Post editorial even claimed that Mexico’s GDP had quadrupled in the years from 1988 to 2007. (The actual growth figure was 83 percent.)
The NYT appears to be getting into the act with an article discussing Mexico’s changing relationship with the U.S. as it inaugurates a new president. The article told readers:
“Mexico fell into a deep recession in 2009 when American demand for Mexican-made imports collapsed. But the recovery under President Felipe Calderón has been notable, with growth expected to reach almost 4 percent this year, roughly twice that of the United States.
While Brazil is often thought of as Latin America’s economic marvel, Mexico’s economy outpaced Brazil’s last year and is expected to do so again this year. Business that had fled Mexico in favor of China has started to return, as the wage gap narrows and transportation and other costs rise.”
A 4.0 percent growth rate is not especially rapid for developing countries. Furthermore, the fact that wages in Mexico have fallen sharply relative to wages in China is bad economic news for the vast majority of people in Mexico. Mexican workers used to be much better off than Chinese workers, the fact that this may no longer be the case is the result of Mexico’s bad economic performance.
No one would seriously change their view of the relative performance of Latin American countries based on a single year’s data. In fact, in terms of miracles, Argentina has done far better than Brazil and Mexico ranks dead last in per capita GDP growth in Latin America from 1996 to the present.
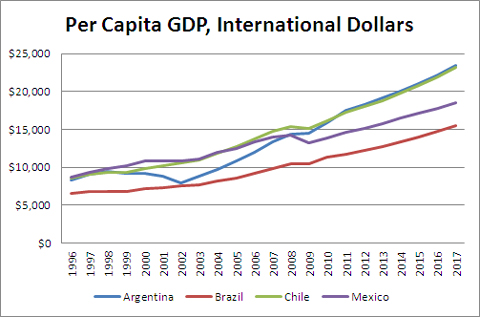
Source: International Monetary Fund.
NAFTA may not have done much to improve Mexico’s growth rate, but its approval sure did wonders for U.S. reporting on Mexico’s economy. The Washington Post in particular has run several pieces touting Mexico’s booming economy and rising middle class (e.g here and here). In fact, a 2007 Post editorial even claimed that Mexico’s GDP had quadrupled in the years from 1988 to 2007. (The actual growth figure was 83 percent.)
The NYT appears to be getting into the act with an article discussing Mexico’s changing relationship with the U.S. as it inaugurates a new president. The article told readers:
“Mexico fell into a deep recession in 2009 when American demand for Mexican-made imports collapsed. But the recovery under President Felipe Calderón has been notable, with growth expected to reach almost 4 percent this year, roughly twice that of the United States.
While Brazil is often thought of as Latin America’s economic marvel, Mexico’s economy outpaced Brazil’s last year and is expected to do so again this year. Business that had fled Mexico in favor of China has started to return, as the wage gap narrows and transportation and other costs rise.”
A 4.0 percent growth rate is not especially rapid for developing countries. Furthermore, the fact that wages in Mexico have fallen sharply relative to wages in China is bad economic news for the vast majority of people in Mexico. Mexican workers used to be much better off than Chinese workers, the fact that this may no longer be the case is the result of Mexico’s bad economic performance.
No one would seriously change their view of the relative performance of Latin American countries based on a single year’s data. In fact, in terms of miracles, Argentina has done far better than Brazil and Mexico ranks dead last in per capita GDP growth in Latin America from 1996 to the present.
Source: International Monetary Fund.
Read More Leer más Join the discussion Participa en la discusión


