


Douthat tells us that the birthrate has fallen below the replacement rate. I haven’t checked this one, but that sure sounds like good news to me. Has anyone noticed a shortage of people anywhere? Do you want more crowded parks and beaches, more traffic congestion, more pollution and global warming?
If people who want kids can’t afford to have them or feel too insecure in their economic situation, that is bad news. But if we are seeing our population decline rather than rise (immigration will actually keep it rising), it’s difficult to see the problem. As I say, it would be great news if this was really the biggest problem we faced.
Read More Leer más Join the discussion Participa en la discusión
Real reporters and newspapers don’t try to tell audiences what political figures think because they don’t know what they think. But Bob Woodward does not fit the description of the former and the Washington Post does not fit the description of the latter, hence we have a front page account of the battle over the debt ceiling that concludes with a section beginning:
“Geithner thought there was one other consideration. He did not mention it to anyone, not even the president, but he had thought about it a great deal. It was not just that Obama faced an economic choice or a political choice. He faced a moral choice.”
The piece then goes on to explain how Geithner thought it would be horribly immoral to default on the debt because of the price the country would pay for generations.
There are two points to be made here. First, Woodward and the Post do not have direct access to Timothy Geithner’s thoughts. Either Geithner conveyed his thoughts to Woodward, in which case this section should begin: “Geithner said there was one other consideration.”
Alternatively, someone close to Geithner told Woodward what Geithner said, in which case the section would begin: “according to Person X (ideally a person with a name as opposed to “someone close to Secretary Geithner”), Geithner said there was one other consideration.” Okay, but this is the Post.
Let’s get to the substance. While we don’t have any clue as to what Geithner really thought, it is worth saying a word about the likely consequences of a debt default. First, it would lead to a serious downturn and big-time financial crisis. If U.S. debt was no longer 100 percent solid, it would almost certainly lead to a financial freeze-up that made the post-Lehman crisis look like a Sunday picnic.
However, the plus side of this would be that it would almost certainly wipe out the Wall Street banks once and for all. We would eliminate this massive parasitic structure that is draining hundreds of billions of dollars a year from the productive economy and is the largest single source of inequality in the economy today.
The other point is that countries do bounce back from financial crises. The best example here is probably Argentina. It had a complete financial meltdown in December of 2001. This led to banks closing and people being unable to access their money. The economy was in free fall for three months. It stabilized in the next three months and began 7 years of robust growth in the fall of 2002. By the middle of 2003 the country had made up all the ground lost in the crisis. In the case of Argentina, the people of the country are almost certainly better off today from having to endure short-term pain for long-term gain.
While economic policy makers in the United States may not be as competent as those in Argentina, even if it took twice as long to regain the lost ground (i.e. three years), the country could still be much better off in the long-run as a result of eliminating the bloat in its financial sector. It would be appropriate for a lengthy discussion of the crisis like the Post’s piece to consider this issue, even if Geithner claims that it would be immoral to allow Wall Street to go under.
Read More Leer más Join the discussion Participa en la discusión
The Washington Post’s article on the August jobs report included an assertion by Bernard Bamouhl, the chief global economist at the Economic Outlook Group, that:
“companies find it hard to justify hiring more people because the economic outlook is so unclear.”
To use a technical economic term, this claim is wrong. We can see this by looking at average weekly hours. If companies would otherwise be hiring people, but are restrained by uncertainty, then they would be working their current workforce more hours.
More hours and more workers are alternative ways to fill demand for labor. The former implies no real risk to a company. If they raise average hours worked by one or two hours a week this month, and then demand conditions change, there is little problem with lowering hours back to their prior level next month.
If Bamouhl’s claim that uncertainty about the future is holding back hiring then average weekly hours would be increasing. That’s not what the Bureau of Labor Statistics tells us.

Source: Bureau of Labor Statistics.
Since average weekly hours have not risen we know that uncertainty is not preventing hiring, but rather a lack of demand.
The Washington Post’s article on the August jobs report included an assertion by Bernard Bamouhl, the chief global economist at the Economic Outlook Group, that:
“companies find it hard to justify hiring more people because the economic outlook is so unclear.”
To use a technical economic term, this claim is wrong. We can see this by looking at average weekly hours. If companies would otherwise be hiring people, but are restrained by uncertainty, then they would be working their current workforce more hours.
More hours and more workers are alternative ways to fill demand for labor. The former implies no real risk to a company. If they raise average hours worked by one or two hours a week this month, and then demand conditions change, there is little problem with lowering hours back to their prior level next month.
If Bamouhl’s claim that uncertainty about the future is holding back hiring then average weekly hours would be increasing. That’s not what the Bureau of Labor Statistics tells us.
Source: Bureau of Labor Statistics.
Since average weekly hours have not risen we know that uncertainty is not preventing hiring, but rather a lack of demand.
Read More Leer más Join the discussion Participa en la discusión
Read More Leer más Join the discussion Participa en la discusión
The media and “fact checkers” seem to have missed it, but President Obama implicitly called for cutting Social Security by 3 percent and phasing in an increase in the normal retirement age to 69 when he again endorsed the deficit reduction plan put forward by Erskine Bowles and Alan Simpson, the co-chairs of his deficit commission.
The reduction in benefits is the result of their proposal to reduce the size of the annual cost of living adjustment by 0.3 percentage points by using a different price index. After 10 years this would imply a reduction in benefits of 3 percent, after 20 years the reduction would be 6 percent, and after 30 years the reduction would be 9 percent. If the average beneficiary lives long enough to collect benefits for 20 years, the average reduction in benefits would be approximately 3 percent.
Since Social Security is enormously important to retirees and near retirees, the media should have called attention to this part of President Obama’s speech. It is likely that many of those listening did not realize that his deficit reduction plan called for these cuts.
Read More Leer más Join the discussion Participa en la discusión
Read More Leer más Join the discussion Participa en la discusión
Dylan Matthews usually writes insightful pieces, but he really strays from the mark today in buying a story that unemployment in today’s economy is to any significant extent an issue of skills. He picks up on a new paper by two economists (Nir Jaimovich from Duke and Henry E. Siu at the University of British Columbia) that argues that structural changes rather than weak demand is the main factor behind weak job growth in the last three recoveries.
Tying structural change to the last three recoveries should immediately raise some hackles. The largest shift upward redistribution in wages from the middle and bottom to the top, occurred in the early 80s. In the folklore of skills biased technical change that dominates the economics profession, the early 80s really hold pride of place as the period that best fits the story. But Jaimovich and Siu want to put the early 80s back in the post-war golden age where we all prospered together. If they are right, then a lot of other economists are seriously wrong.
But getting to the substance, the real issue here is if there was a ton of new demand in the economy — the government had a huge make work program, the dollar plunged and net exports soared, and job creators doubled their investment inspired by the Romney-Ryan vision for America (just kidding) — whether or not we would not see a huge surge in employment. It’s hard to see anything in Jaimovich and Siu’s paper that would suggest otherwise.
We know that less educated workers bear the brunt of unemployment any time the economy falls below full employment. This was the theme of my book with Jared Bernstein a decade ago (The Benefits of Full Employment). There’s a simple logic to this. The marginal workers that firms hire when demand picks up tend to be less educated on average than the core workers who stay employed no matter what.
Think of a factory where output has been cut by 50 percent or a store where sales fall by the same amount. The managers likely stay on in their jobs, as well as the most skilled maintenance crew in the case of the factory. The people who get laid off will be the line workers in the case of the factory or the retail clerks in the case of the store. However this change in skills mix is not an indication of a change in technology, it’s an indication of weak demand.
If we actually had a serious issue with technology changing the mix of skills needed in the economy then we should be able to find large sectors of the economy where there are large numbers of job openings, where wages are rising rapidly and the average weekly hours are surging. We don’t see this. (Yes, employers complain about not being able to find qualified workers, but if this is true then our job creators have forgotten how to raise wages.)
The real story of this downturn seems very simple. We had a huge housing bubble that was driving the economy through its effect on consumption and residential construction. When it collapsed, it created a gap in demand on the order of $1.2-$1.5 trillion. There is no easy way for private sector demand to fill this gap. (Anyone got a story of how that would work?)
This means that we have to rely on government deficits to fill the demand gap in the short-term. In the longer term we should be looking to reducing the trade deficit. Residential construction should also help as it gradually returns to its trend levels from the extraordinarily depressed levels that resulted from the overbuilding of the bubble years.
Anyhow, the housing bubble story provides a simple answer as to why we are not creating jobs. I suppose we can keep a lot of economists employed looking for other explanations, but aren’t there more productive things they would be doing?
Read More Leer más Join the discussion Participa en la discusión
A NYT piece contrasting the politics of Elizabeth Warren and Bill Clinton tells readers that:
“Mr. Clinton is the president who made the sustained case to Democrats that they had to be pro-growth and pro-Wall Street, not just to get elected, but also to build a more modern economy.”
There is considerable evidence that these are contradictory positions. Our bloated financial sector is a drain on growth as shown in a recent paper from the Bank of International Settlements. Resources that could be deployed productively are instead applied to rent-seeking activity in the financial sector.
This paper found that a large financial sector posed the largest burden on sectors with more research and development and were heavily dependent on external financing. In the former case, finance apparently pulls away workers who might otherwise be employed as scientists and technicians elsewhere in the economy. In the latter case, finance driving up speculative bubbles could displace finance for new investment.
President Clinton’s policies set the country on a course of bubble driven growth. The prosperity of the last four years of his administration was driven by an unsustainable stock bubble. The collapse of the bubble was responsible for the recession of 2001 (and the deficits that get the Washington establishment types so excited). It was difficult for the economy to recover from this downturn which led to, at the time, the longest period without job growth since the Great Depression. When the economy finally did recover from this downturn and start to create jobs it was on the back of the housing bubble.
This is the economic model that President Clinton is associated with. By contrast, Elizabeth Warren is associated with a growth model that builds on broadly shared income gains. The track record suggests that the Warren model is far more effective.
Read More Leer más Join the discussion Participa en la discusión
The Democrats’ discussion of the loss of the Clinton budget surpluses is a tale of paradise lost. Unfortunately, it was an illusory paradise that serious people should not concern themselves with. That is why it is disappointing to see Ezra Klein give us more tales of the evaporating budget surplus.
The huge surpluses of the last Clinton years were the result of a boom that was driven by a stock bubble. The boom was great. Millions of people got jobs who would not have otherwise. We also saw real wage gains up and down the income distribution for the first time since the early 70s.
The greatest minds in the economics profession had assured us that the unemployment rate could not get below 6.0 percent without touching off accelerating inflation. However the boom pushed the unemployment rate down to 4.0 percent as a year-round average in 2000. Guess what? There was no story of accelerating inflation. (Fortunately for economists, continued employment, and even standing in the profession, does not depend on performance.)
But the key point is that the surplus came from a boom that was not sustainable. Here’s the key chart that shows you how we went from the deficit of 2.7 percent of GDP that the Congressional Budget Office had projected in 1996 for 2000 to the surplus of 2.4 percent of GDP that we actually saw in 2000.
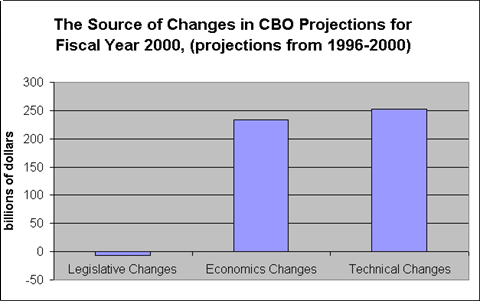
Source: Congressional Budget Office and author’s calculations.
This was not a story of tax increases and budget cuts, those had already been on the books by 1996. This was pure and simple a story of the bubble-based boom pushing the economy much further than CBO had expected. (Greenspan deserves a huge amount of credit for allowing the unemployment rate to fall. His Clinton appointed colleagues, Lawrence Meyer and Janet Yellen, wanted to raise interest rates in 1996 to keep unemployment from falling much below 6.0 percent.)
Anyhow, when the bubble burst, the surplus was destined to vanish. The Bush tax cuts and even the wars helped to stimulate the economy and maintain employment. There were much better ways to boost the economy, but it is absurd to imagine that the economy somehow would have been better off without this spending.
To repeat a post from last week, the real tragedy of both conventions is that policy is so obsessed with the deficit. No one apart from a few policy wonks in DC even has a clue as to the size of the deficit. (Quick, give it to me to the nearest hundred billion.) Contrary to the scare stories, the burden of the debt (a.k.a. interest payments) are near a post-war low as a share of GDP, not a record high.
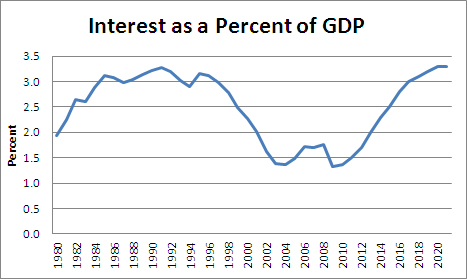
Source: Congressional Budget Office.
Topics one, two, and three should be jobs, jobs, and jobs. The deficit is a distraction. And the tale of the vanishing Clinton era budget surpluses, well that’s something for retired budget wonks to reminisce over in their golden years.
Addendum:
Many good questions are raised below. I’ll just address a few points. First, I have zero interest in getting into debates on the budget deficit. I don’t care whether the government runs a budget surplus, so the particular accounting is of no interest to me apart from the fact that it needs to be consistent through time. I suppose we can have some good make work jobs having people design new budget methodologies, but I don’t intend to get involved myself.
In terms of the causes of the deficits/debt, a lot depends on the baseline. My baseline was 1996 since I wanted to show that Clinton did not give us a balanced budget/surplus, the stock market bubble did. The spending/tax cuts that followed the recession were needed to boost the economy. Unless you like to see people out of work, you should be happy for the deficit. Of course the tax cuts and money spent on the war could have been much better directed, but if the choice was no tax cuts and no additional military spending versus what we got, there can be little doubt that the latter created more jobs.
The Democrats’ discussion of the loss of the Clinton budget surpluses is a tale of paradise lost. Unfortunately, it was an illusory paradise that serious people should not concern themselves with. That is why it is disappointing to see Ezra Klein give us more tales of the evaporating budget surplus.
The huge surpluses of the last Clinton years were the result of a boom that was driven by a stock bubble. The boom was great. Millions of people got jobs who would not have otherwise. We also saw real wage gains up and down the income distribution for the first time since the early 70s.
The greatest minds in the economics profession had assured us that the unemployment rate could not get below 6.0 percent without touching off accelerating inflation. However the boom pushed the unemployment rate down to 4.0 percent as a year-round average in 2000. Guess what? There was no story of accelerating inflation. (Fortunately for economists, continued employment, and even standing in the profession, does not depend on performance.)
But the key point is that the surplus came from a boom that was not sustainable. Here’s the key chart that shows you how we went from the deficit of 2.7 percent of GDP that the Congressional Budget Office had projected in 1996 for 2000 to the surplus of 2.4 percent of GDP that we actually saw in 2000.
Source: Congressional Budget Office and author’s calculations.
This was not a story of tax increases and budget cuts, those had already been on the books by 1996. This was pure and simple a story of the bubble-based boom pushing the economy much further than CBO had expected. (Greenspan deserves a huge amount of credit for allowing the unemployment rate to fall. His Clinton appointed colleagues, Lawrence Meyer and Janet Yellen, wanted to raise interest rates in 1996 to keep unemployment from falling much below 6.0 percent.)
Anyhow, when the bubble burst, the surplus was destined to vanish. The Bush tax cuts and even the wars helped to stimulate the economy and maintain employment. There were much better ways to boost the economy, but it is absurd to imagine that the economy somehow would have been better off without this spending.
To repeat a post from last week, the real tragedy of both conventions is that policy is so obsessed with the deficit. No one apart from a few policy wonks in DC even has a clue as to the size of the deficit. (Quick, give it to me to the nearest hundred billion.) Contrary to the scare stories, the burden of the debt (a.k.a. interest payments) are near a post-war low as a share of GDP, not a record high.
Source: Congressional Budget Office.
Topics one, two, and three should be jobs, jobs, and jobs. The deficit is a distraction. And the tale of the vanishing Clinton era budget surpluses, well that’s something for retired budget wonks to reminisce over in their golden years.
Addendum:
Many good questions are raised below. I’ll just address a few points. First, I have zero interest in getting into debates on the budget deficit. I don’t care whether the government runs a budget surplus, so the particular accounting is of no interest to me apart from the fact that it needs to be consistent through time. I suppose we can have some good make work jobs having people design new budget methodologies, but I don’t intend to get involved myself.
In terms of the causes of the deficits/debt, a lot depends on the baseline. My baseline was 1996 since I wanted to show that Clinton did not give us a balanced budget/surplus, the stock market bubble did. The spending/tax cuts that followed the recession were needed to boost the economy. Unless you like to see people out of work, you should be happy for the deficit. Of course the tax cuts and money spent on the war could have been much better directed, but if the choice was no tax cuts and no additional military spending versus what we got, there can be little doubt that the latter created more jobs.
Read More Leer más Join the discussion Participa en la discusión
Eduardo Porter has an interesting piece pointing out that in many respects Richard Nixon’s economic policy was well to the left of Barack Obama’s (no doubt attributable to his Kenyan socialist background). Clearly the center of economic debate has moved well to the right.
Porter attributes much of this shift to the rise of global competition. Increased international competition can help to explain the desire to push down wages of ordinary workers, but it doesn’t explain why corporations have not felt the need to push down the wages of their lawyers, the doctors they indirectly pay through employer provided health insurance, or their CEOs. The pay for these groups are hugely out of line with international standards even though there is zero reason to believe that the professionals who fill these jobs in the United States perform their work any better than their peers elsewhere.
The explanation would seem to be that these professionals have been able to secure protection for themselves in ways that autoworkers and textile workers have not. In the case of CEOs, they essentially pay off board members to turn the other way as they pilfer the corporations they run. In short, the end of decent paying jobs for ordinary workers is not due to globalization, it is due to the fact that certain powerful interest groups have been able to use the forces of globalization to their advantage.
Read More Leer más Join the discussion Participa en la discusión


