


Read More Leer más Join the discussion Participa en la discusión
Robert Samuelson devotes his column today to misrepresenting a new article in the Journal of the American Medical Association, claiming that it shows the Ryan-Romney Medicare plan would save money. In fact, the article compares costs of Medicare Advantage plans with the current traditional Medicare plan. It notes that in many cases the former are lower, however it does not attribute the savings to the more efficient delivery of care. It notes that lower costs may be due to healthier patients, which has been the finding of other research, such this study by Kaiser via Jared Bernstein.
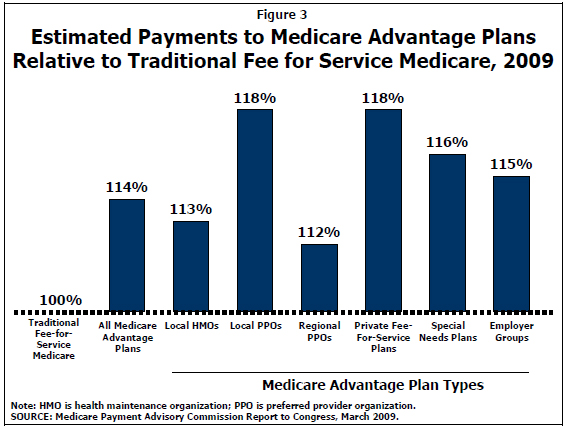
Source: Kaiser Family Foundation.
There is nothing in the new study that should lead Samuelson’s readers to believe that the Ryan-Romney plan will save money.
Interestingly, Samuelson makes the standard conservative argument that the use of private insurers to provide the Medicare drug benefit was the reason that the cost has been far below projections, holding this up as an example for the larger program. In fact the main reason that costs have been far lower than had been projected was that drug costs in general have risen far less rapidly than had been projected. The reason for the slower than projected increase in drug costs has been a reduced pace of new drug development.
The Food and Drug Administration rates new drugs as “priority” reviews or “standard” reviews depending on whether the drug is potentially a qualitative breakthrough over existing drugs. While it might be expected that the number of priority drug approvals would increase through time due to the increase in the money that the industry claims to be spending on research, it actually has fallen sharply in the years since the Medicare drug benefit was approved. While it is unlikely that the decision to use private insurers to provide the Medicare drug benefit is the reason for this slowdown in innovation, Samuelson has at least a prima facie case if that is what he wants to argue.
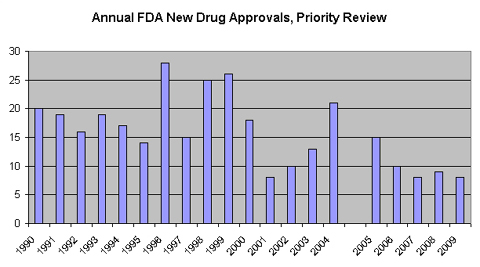
Source: FDA and Knowledge Ecology International.
Of course it is possible for the government to save money by introducing choice into Medicare. It could allow beneficiaries to buy into more efficient health care systems elsewhere in the world and split the savings. Based on current cost projections, in a couple of decades this plan could have the government and beneficiaries splitting tens of thousands of dollars a year in annual savings. Unfortunately Samuelson, like most proponents of vouchers, is too hard core protectionist to consider this sort of plan.
Robert Samuelson devotes his column today to misrepresenting a new article in the Journal of the American Medical Association, claiming that it shows the Ryan-Romney Medicare plan would save money. In fact, the article compares costs of Medicare Advantage plans with the current traditional Medicare plan. It notes that in many cases the former are lower, however it does not attribute the savings to the more efficient delivery of care. It notes that lower costs may be due to healthier patients, which has been the finding of other research, such this study by Kaiser via Jared Bernstein.
Source: Kaiser Family Foundation.
There is nothing in the new study that should lead Samuelson’s readers to believe that the Ryan-Romney plan will save money.
Interestingly, Samuelson makes the standard conservative argument that the use of private insurers to provide the Medicare drug benefit was the reason that the cost has been far below projections, holding this up as an example for the larger program. In fact the main reason that costs have been far lower than had been projected was that drug costs in general have risen far less rapidly than had been projected. The reason for the slower than projected increase in drug costs has been a reduced pace of new drug development.
The Food and Drug Administration rates new drugs as “priority” reviews or “standard” reviews depending on whether the drug is potentially a qualitative breakthrough over existing drugs. While it might be expected that the number of priority drug approvals would increase through time due to the increase in the money that the industry claims to be spending on research, it actually has fallen sharply in the years since the Medicare drug benefit was approved. While it is unlikely that the decision to use private insurers to provide the Medicare drug benefit is the reason for this slowdown in innovation, Samuelson has at least a prima facie case if that is what he wants to argue.
Source: FDA and Knowledge Ecology International.
Of course it is possible for the government to save money by introducing choice into Medicare. It could allow beneficiaries to buy into more efficient health care systems elsewhere in the world and split the savings. Based on current cost projections, in a couple of decades this plan could have the government and beneficiaries splitting tens of thousands of dollars a year in annual savings. Unfortunately Samuelson, like most proponents of vouchers, is too hard core protectionist to consider this sort of plan.
Read More Leer más Join the discussion Participa en la discusión
The NYT did a classic he said/she said on the debate between the presidential candidates over Medicare. While such coverage is easy for reporters it is not very helpful to readers who generally have less time than reporters to determine the truth of specific claims.
For example, it might have been helpful to point out to readers that the Romney-Ryan budget assumes $716 billion in unspecified cuts to Medicare over the next decade. These mystery cuts are due to the fact that they have promised to repeal the Affordable Care Act (ACA) and thereby get rid of the projected Medicare savings for which it provides. Nonetheless, the budget assumes that Medicare would cost the same as President Obama had projected with these cuts.
This means that Romney and Ryan must envision other cuts to the program over this period that they have yet to specify. That would have been useful information to provide readers.
Correction: A new blogpost from the Romney campaign indicates that, unlike the Ryan budget, he does not assume $716 billion in Medicare savings from the ACA. He would repeal the act and then start with a projected spending level that is $716 billion higher over the next decade than President Obama’s budget. Thanks to Robert Salzberg for catching this one.
Read More Leer más Join the discussion Participa en la discusión
Take the poll and add your two cents. Here’s mine:
How about limited global competition? There are plenty of smart people in China and India who could train to U.S. standards and would be delighted to work as doctors or lawyers in the U.S. at $100k a year. That would reduce inequality.
How about a change in norms among corporate board members who essentially get paid off to let the CEOs pilfer the company? It’s their job to restrain CEO pay. They don’t do it.
How about stronger patent and copyright protection. We spend $300 billion a year on prescription drugs that would sell for $30 billion in a free market. Those patent rents don’t go to people in the bottom 99 percent for the most part.
Deregulation is far too generous a term for the financial industry? If they had actual deregulation, meaning a lack of government involvement, most of Wall Street would be bankrupt right now. In fact, they have too-big-to-fail insurance which is provided free by the taxpayers.
Inequality is not something that just happened. Inequality was engineered by the folks who have power.
Read More Leer más Join the discussion Participa en la discusión
The NYT had an interesting piece on how a new generation of robots is able to do far more sophisticated tasks in factories and warehouses than earlier generations of robots. The piece repeatedly warns that this new technology could cost large numbers of jobs.
While one outcome of the introduction of this new technology could be the loss of jobs in the economy, that would be due to inept economic policy. What the article is describing is productivity growth. This is exactly what we should want. It allows us to be richer if we work the same number of hours or to be as rich and work fewer hours. We had very rapid productivity growth in the three decades following World War II. It did not lead to unemployment, but rather to rapidly rising living standards for the bulk of the population.
In the last three decades the government has pursued policies that have the effect of redistributing income upward so that the gains from growth are not broadly shared. These policies include a high dollar policy that makes U.S. manufacturing goods less competitive domestically and internationally, a policy of selective protectionism that largely protects the most highly educated professionals (e.g. doctors and lawyers) from foreign competition, and a policy of shifting tens of billions of dollars each year to Wall Street banks through “too big to fail” insurance provided at zero cost by the government.
If this new generation of robots ends up making large segments of the population worse off, it will be the result of deliberate policies. It is not the fault of the robots.
Read More Leer más Join the discussion Participa en la discusión
The Washington Post devoted a major front page article to the results of a poll that it sponsored along with the Kaiser Foundation on attitudes of the public to the role of government in the economy. The poll purported to find large divides between most Democrats and Republicans on the proper role of government in the economy and whether people preferred bigger or smaller government.
The piece (presumably following the poll) fundamentally misrepresents the role that the government plays in the economy. It implies that “big government” means a government that taxes and/or spends a great deal, ignoring all the ways in which government interventions determine flows of money that do not involve direct taxation or spending.
To take an obvious example, government granted patent monopolies raise the price of prescription drugs by close to $270 billion a year compared to the free market price. In terms of its impact on the economy and people’s lives this has roughly the same effect as if the government were to raise taxes by $270 billion a year (more than $3 trillion over a decade — keeping pace with the growth of the economy) and use the money to pay drug companies to develop drugs.
Similarly, the high dollar policy that the United States has pursued since the Clinton years has the effect of destroying jobs and lowering wages in sectors of the economy (most importantly manufacturing) that are exposed to international competition. The high dollar policy is a major factor redistributing income from the bulk of the workforce to those who have the political power to largely protect themselves from international competition (e.g. doctors and lawyers).
The government also transfers tens of billions of dollars a year to the financial sector through the “too big to fail” insurance that it provides at no cost to the major Wall Street banks. This governmental support provides the basis for many Wall Street fortunes.
The WAPO piece fundamentally misrepresents the importance of government in the economy by reducing it tax and spending policy. The impacts of these policies are trivial compared with the impact that government policies have in structuring markets. It is simply wrong to imply that a government is “small” by virtue of the fact that it does not tax or spend much compared to the size of the economy.
Read More Leer más Join the discussion Participa en la discusión
AP has been running a series of widely distributed columns that have been trying to convince readers that the Social Security system is in crisis and is in desperate need of fixing. These pieces have contributed to the misinformation on the topic that has been widely disseminated by wealthy people like Peter Peterson and the Washington Post.
These pieces routinely try to scare the public by expressing the size of the projected Social Security shortfall in large numbers that lack any context. This pattern continues in the last AP column. The article told readers:
“Once Social Security’s surplus is gone, the program is scheduled to pay out $134 trillion more in benefits than it will collect in taxes over the next 75 years, according to data from the agency. Adjusted for inflation, that’s $30.5 trillion in 2012 dollars.”
These are really big numbers and the piece would have provided just as much information to its readers if it substituted the words “really big number” for $134 trillion or $30.5 trillion. Virtually none of the people reading this article has any idea of how large the economy will be over the next 75 years so they have no basis for assessing the size of these numbers.
It is easy to express the projected shortfalls in ways that would be understandable to readers. The Social Security trustees projection of the size of the shortfall is equal to approximately 0.9 percent of GDP over the 75-year planning horizon. The Congressional Budget Office’s projection of the shortfall is equal to approximately 0.5 percent of GDP. Put another way, the shortfall projected by the Trustees could be fully met with a tax increase equal to roughly 5 percent of projected wage growth over the next three decades. It would have been much more informative to use such ratios to express the size of the shortfall, although perhaps somewhat less scary.
The piece is also misleading in its comment:
“But the sooner changes are made, the more subtle they can be because they can be phased in slowly. Each year lawmakers wait, Social Security’s financial problems loom larger and the need for bigger changes becomes greater, according to an analysis by The Associated Press.”
While this is true (if we cut benefits or raise taxes for more people, then the benefit cut or tax increase per person would be less), the article implies that the increase in the projected size of the shortfall from the 2011 Trustees report to the 2012 Trustees report had little to do with waiting. The main reason that there was a sharp increase in the projected shortfall is that the Trustees used more pessimistic assumptions about the program. If the program had been brought into balance based on the 2011 projections, the changes in projections in 2012 would again show the program to be unbalanced. Waiting had nothing to with it.
Read More Leer más Join the discussion Participa en la discusión
David Leonhardt poses the bizarre question in the headline of a blog post today: “Is Simple Demography Behind Weak Economy?”
There is a simple answer to this simple question, “no.”
The basic story, which is well-known to those who read the monthly employment numbers, or who are unemployed themselves, is a lack of jobs, not a lack of workers. Yes, population growth and therefore labor force growth has slowed. This would imply a lower growth rate of potential GDP. That means that once we have absorbed all the excess labor and the unemployment rate is back down to the 4-5 percent range, we would expect somewhat slower growth going forward.
However, there is no story that passes the laugh test that says that slower population growth explains our inability to employ the existing population. (Let’s see, smaller supply of workers, therefore smaller demand for workers. I must have missed that lecture in my econ classes.)
The annoying part of this story is that it is really hard to understand the mystery that Leonhardt is trying to explain. The housing bubble was generating around $1.2 trillion in demand that disappeared when it collapsed. Half of this was in residential construction and half was in consumption driven by bubble generated home equity. (You can throw in another $100-$200 billion in state and local spending supported by housing bubble generated tax revenue and also the bubble in non-residential real estate.)
This demand is gone now. It cannot be replaced by magic. The budget deficit has filled part of the gap, but there is no mechanism in the private sector that allows it to easily fill this gap in demand. (Can Leonhardt or anyone else identify the missing mechanism?)
In short, this is an effort to create a mystery where there is none. It is annoying because it distracts from serious solutions (spend money, stupid) and it also helps to absolve the dingbats who wrecked the economy of their guilt. The people who failed to see the housing bubble should all be thrown out on their rears and forced to look for work. They messed up as badly as they possibly could and do not deserve to continue to get 6-figure salaries at a time when so many people are suffering from their ungodly incompetence.
[Typos corrected 4:30 P.M. August 19.]
Read More Leer más Join the discussion Participa en la discusión
The normally astute Martin Wolf failed to do his homework for a column yesterday in which he described the deficit reduction plan put forward by Morgan Stanley director Erskine Bowles and former Senator Alan Simpson as “the only politically realistic long-term fiscal solution.”
Actually there is a much politically viable solution: do nothing. Yes, this will make the deficit hawks at the Washington Post and other such places yell and scream, but it is both politically viable and economically solid. Unlike Bowles-Simpson, the do-nothing plan would not further slow the economy. (Remember, Bowles-Simpson as originally designed would have begun deficit reduction on October 1, 2011.) The do-nothing plan is obviously politically viable since it is currently what we are doing, more or less. (We’ll have to see how the end of 2012 issues get resolved.)
The economic reality is that we face no urgency to do anything on the deficit. We will undoubtedly need some additional revenues over the longer term, in addition to reversing the Bush tax cuts for the richest 2 percent, but it is possible that other better solutions will become politically viable, for example a Wall Street speculation tax that would hit big banks like the one where Mr. Bowles serves as a director. (It’s funny how they never considered taxing Wall Street.)
It’s also possible that we will fix the health care system so it doesn’t take an absurdly large share of GDP. That would require that folks like the insurers, drug companies and doctors take a hit, but it is principle possible that we could see enough political pressure in the future that this tiny elite is forced to take the hit rather than tens of millions of seniors living on $20,000 a year.
Read More Leer más Join the discussion Participa en la discusión
The NYT ran a promotion for Representative Paul Ryan as a news story. The piece did not include a single critical comment from any of the people interviewed.
This is truly remarkable since many of Ryan proposals would add enormous costs to the economy and/or don’t seem to add up. For example, according to the Congressional Budget Office’s projections, his 2011 Medicare proposal would have increased the cost to the country of providing Medicare equivalent insurance policies by $34 trillion over Medicare’s 75-year planning period. His proposal for Social Security privatization would have added tens of billions of dollars annually to the administrative costs of Social Security.
In addition, his latest Medicare plan claims to save the same $750 billion over the next decade in Medicare as President Obama, but it does not include any of the cost control provisions. (Ryan says that he will repeal the Affordable Care Act.) He also has a budget that projects that government spending outside of Social Security and health care will be reduced to 3.75 percent of GDP by 2050. This is less than current spending on the military, which Representative Ryan claims he wants to maintain at or above current levels. This implies that he wants to eliminate the rest of the federal government, if it is taken seriously.
If it was not possible to find any conservatives who care about needless economic waste or blatant errors in arithmetic, the NYT should have found people with a different ideological perspective who could have made these points. Newspapers are not supposed to be used for fluff pieces for candidates, these are supposed to be written by their campaigns.
Addendum: Paul Ryan could not even figure out that it did not make sense to blame President Obama for the closure of a large GM plant in his district that took place while President Bush was still in the White House. Is this what passes as an “intellectual” in conservative circles?
Read More Leer más Join the discussion Participa en la discusión


