


Regular readers of the Washington Post know that they have a hard time getting information at the newspaper, buried as it is in the center of the national’s capital. Robert Samuelson gave more evidence of this problem in his column today on the renewed difficulties facing Spain.
Samuelson told readers:
“in truth, no one has a neat solution to end Europe’s financial nightmare.”
Actually, many of us have proposed what would seem like a pretty neat solution, have the European Central Bank guarantee Spain’s debt. That would immediately push the interest rates paid by the Spanish government down to the levels paid by the German government. That would make Spain’s debt burden easily sustainable.
Spain does need to re-establish its competitiveness which can best be done within the euro zone by having a somewhat higher rate of inflation in Germany and other core countries. If Spain can sustain a lower rate of inflation than the core countries then it will be able to get its current account deficit with other euro zone nations back to a reasonably level.
Samuelson should know that many prominent economists have advocated this sort of solution. He may think it is a bad option for some reason, but then he should present the reason. As it stands, his column makes it sound as though he has no clue on the nature of the debate over euro zone policy.
Read More Leer más Join the discussion Participa en la discusión
Just as it refuses to accept global warming or evolution, much of the right is busy trying to deny the evidence on income inequality. As Thomas Edsall notes in his column today, they don’t have much of a case.
The big point that they are hitting on these days is that most middle income and poor people get health insurance, either from their employer or the government, which costs lots of money. If we add in this expense to their cash income, then the rise in inequality does not seem as large.
There are two important points to consider on this issue. The cost of health insurance is money being paid to highly paid medical specialists, insurers, and drug companies. It seems a bit perverse to argue that the poor are actually doing better than we thought because we are paying lots of money to cardiologists.
The other point is to keep in mind is that if we look at health outcomes like life expectancy, then it adds to the view that inequality is increasing. While all income groups shared more or less equally in the gains in life expectancy in the three decades immediately following World War II, a hugely disproportionate share of the gains have gone to the top in last three decades.
This suggests that if we measure what low and middle income people get by way of health care, instead of what the government and employers pay, the growth of inequality might be even worse than the commonly used data indicate.
Read More Leer más Join the discussion Participa en la discusión
Thomas Friedman once again derides partisanship and division in his column today. (Can you really get paid at the NYT for writing the same column over and over again? I used to make my students write new papers if they expected credit.) Anyhow, he mourns the divisiveness of U.S. politics and tells us that we need (relying on Frank Fukuyama):
“‘If we are to get out of our present paralysis, we need not only strong leadership, but changes in institutional rules,’ argues Fukuyama. These would include eliminating senatorial holds and the filibuster for routine legislation and having budgets drawn up by a much smaller supercommittee of legislators — like those that handle military base closings — with ‘heavy technocratic input from a nonpartisan agency like the Congressional Budget Office,’ insulated from interest-group pressures and put before Congress in a single, unamendable, up-or-down vote.”
Those of us familiar with economics shiver when we hear a call for more “technocratic input” that is not accountable to democratic control. After all, it was the economic technocrats who insisted that everything was just fine as the housing bubble expanded to ever more dangerous levels.
Is there any reason to believe that the technocrats involved in economic policy making today are any more competent than the crew in charge from 2002-2008? There is no obvious evidence that this is the case, after all, it is largely the same crew.
Why would anyone in their right mind want to give the people who drove the economy off a cliff more power? Maybe when they get the economy back to full employment we can have this discussion, but as long as so many people are out of work, our economic experts should feel lucky to be employed. The last thing we should be considering is giving them more power.
Read More Leer más Join the discussion Participa en la discusión
Fox on 15th Street is on the loose again. A Washington Post article on renewed worries over European sovereign debt referred to:
“massive cuts in government spending aimed at reducing deficits that ballooned during the credit bubble of the past decade.”
No, the deficits did not balloon during the bubble. Greece and Portugal did run large deficits in the bubble years. However Italy’s debt to GDP ratio was falling and the other two crisis countries, Spain and Ireland, were running budget surpluses.
How can a Washington Post reporter not know these facts? How can an editor allow this assertion to get into print? We know that claims like this fit the Post’s obsession with deficits, but the paper should show a bit more respect for the facts.
Read More Leer más Join the discussion Participa en la discusión
In keeping with its new journalism model of eviscerating the distinction between news and editorial positions, the Washington Post told readers in a news article that “populism is running out of gas in Latin America,” using the words of Arturo Porzecanski, a Uruguayan economist who teaches at American University in Washington. Mr. Porzecanski is one of several critical voices used as sources for the piece. (The only statement from a supporter of the populist governments is a comment from Venezuela’s oil minister, which appears to have been given at a press conference.)
The data do not seem to agree with Mr. Porzecanski. The piece mentions 11 countries in Latin America, 5 of which (Argentina, Bolivia, Ecuador, Nicaragua, and Venezuela) it identifies as populist. The chart below shows per capita GDP growth in each country either from 2000-2011 or from the year when a populist government assumed power until 2011.

Source: International Monetary Fund.
There is certainly no case here that the populist governments, as identified by the Post, are doing worse than the Post favorites. Argentina ranks first among the whole group with an average per capita growth rate that avearges almost 6.0 percentage points above WAPO favorite Mexico. Bolivia and Ecuador are very much in the middle of the pack, even though the relatively brief period of populist rule includes the years of the world economic crisis. (Ecuador’s growth would put it above both Chile and Colombia for the period that overlaps with populist rule and Uruguay’s growth puts it above Chile for the period of overlap.) Even relatively slow-growing Venezuela has seen more rapid growth under populist rule than in the prior two decades when per capita GDP fell.
There has also been a substantial reduction in inequality in the countries the Post identified as populist (as opposed to an increase in inequality in Mexico). This means that the typical person in these countries has likely seen a sharp improvement in living standards.
Ironically the context for this piece is the decision by Argentina’s government to re-nationalize the largest oil company in the country. (It had been privatized in the 90s.) Several of the countries held up by the Post as models, notably Brazil and Mexico, already have state owned oil companies.
In keeping with its new journalism model of eviscerating the distinction between news and editorial positions, the Washington Post told readers in a news article that “populism is running out of gas in Latin America,” using the words of Arturo Porzecanski, a Uruguayan economist who teaches at American University in Washington. Mr. Porzecanski is one of several critical voices used as sources for the piece. (The only statement from a supporter of the populist governments is a comment from Venezuela’s oil minister, which appears to have been given at a press conference.)
The data do not seem to agree with Mr. Porzecanski. The piece mentions 11 countries in Latin America, 5 of which (Argentina, Bolivia, Ecuador, Nicaragua, and Venezuela) it identifies as populist. The chart below shows per capita GDP growth in each country either from 2000-2011 or from the year when a populist government assumed power until 2011.
Source: International Monetary Fund.
There is certainly no case here that the populist governments, as identified by the Post, are doing worse than the Post favorites. Argentina ranks first among the whole group with an average per capita growth rate that avearges almost 6.0 percentage points above WAPO favorite Mexico. Bolivia and Ecuador are very much in the middle of the pack, even though the relatively brief period of populist rule includes the years of the world economic crisis. (Ecuador’s growth would put it above both Chile and Colombia for the period that overlaps with populist rule and Uruguay’s growth puts it above Chile for the period of overlap.) Even relatively slow-growing Venezuela has seen more rapid growth under populist rule than in the prior two decades when per capita GDP fell.
There has also been a substantial reduction in inequality in the countries the Post identified as populist (as opposed to an increase in inequality in Mexico). This means that the typical person in these countries has likely seen a sharp improvement in living standards.
Ironically the context for this piece is the decision by Argentina’s government to re-nationalize the largest oil company in the country. (It had been privatized in the 90s.) Several of the countries held up by the Post as models, notably Brazil and Mexico, already have state owned oil companies.
Read More Leer más Join the discussion Participa en la discusión
That seemed to be what the NYT was telling readers in an article that began by noting the difficulties that the Dutch government is facing in pushing its austerity plan. The piece noted that a number of countries had committed an additional $430 billion to the IMF for dealing with fallout from the eurozone debt crisis, then added:
“But that money comes with the understanding that Europe will be vigilant in fighting off speculative attacks, bringing down unwieldy budgets and spurring growth.”
The most obvious mechanism for spurring growth is ending austerity. However, the European Central Bank and the IMF do not appear to give any hint that they have this intention. If they continue to press government to “bring down unwiedly budgets,” then they are taking steps to slow growth. If they don’t understand this fact, then they are in the wrong line of work.
Read More Leer más Join the discussion Participa en la discusión
A NYT piece on shortages in Venezuela told readers:
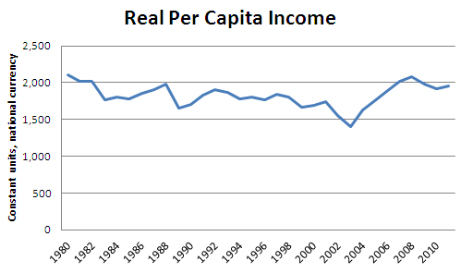
“Venezuela was long one of the most prosperous countries in the region, with sophisticated manufacturing, vibrant agriculture and strong businesses, making it hard for many residents to accept such widespread scarcities.”
This may give the impression that Venezuela’s economy was strong before Hugo Chavez came to power in 1998. This is not true. According to the I.M.F., per capita income was actually 11.8 percent lower in 1998 than it had been 18 years earlier in 1980. Since Chavez came to power per capita income has risen by 4.9 percent. While this is hardly robust growth, since it was accompanied by greater equality in the distribution of income there can be little doubt that most Venezuelans have fared better under Chavez than under his predecessors.
Source: International Monetary Fund.
A NYT piece on shortages in Venezuela told readers:
“Venezuela was long one of the most prosperous countries in the region, with sophisticated manufacturing, vibrant agriculture and strong businesses, making it hard for many residents to accept such widespread scarcities.”
This may give the impression that Venezuela’s economy was strong before Hugo Chavez came to power in 1998. This is not true. According to the I.M.F., per capita income was actually 11.8 percent lower in 1998 than it had been 18 years earlier in 1980. Since Chavez came to power per capita income has risen by 4.9 percent. While this is hardly robust growth, since it was accompanied by greater equality in the distribution of income there can be little doubt that most Venezuelans have fared better under Chavez than under his predecessors.
Source: International Monetary Fund.
Read More Leer más Join the discussion Participa en la discusión
In its top of the hour news segment, Morning Edition told listeners that weekly unemployment claims fell last week (sorry, no link). This is sort of true, since claims were reported at 386,000 compared to 388,000 the prior week.
However the more important news here was that this was the second consecutive week in which claims were above 380,000 after hovering near 360,000 for the last two months. The number from two weeks ago was also revised upward with the release of yesterday’s data from 380,000 to 388,000. Almost every report in the last year has been revised upward the following week.
In this context, the latest release was not good news about the state of the economy.
Read More Leer más Join the discussion Participa en la discusión
In search of good news in yesterday’s data releases, the Washington Post told readers that the median price for existing homes was 2.5 percent above its year ago level. While this is accurate, it is worth noting that the monthly price numbers are highly erratic.
The median sales price in March was more than 5 percent above the median price in February. This sort of month to month increase reflects the mix of homes sold and reporting error. It is not plausible that the price of a typical home actually rose 5 percent in a single month.
Read More Leer más Join the discussion Participa en la discusión
Politicians always like to give things to small businesses (many of which seem to be quite large). While the economics makes no sense, there is great politics to taxing workers to give even the most incompetent, greedy and corrupt people money, if they happen to own a business.
This is fairly obviously the logic of a Republican tax cut bill approved by the House which would give some small businesses a tax cut of 20 percent. While the bill was obviously a political gesture in an election year, since there was no chance that the Senate would approve it or that President Obama would sign it, it still may have been useful for the media to provide some explanation of what the bill would do.
The Post failed in this task, most importantly by not pointing out that the bill would only reduce taxes on businesses that are incorporated as separate entities and therefore pay the corporate income tax. This is important because the vast majority of small businesses are proprietorships or partnerships that do not pay the corporate income tax. These small businesses would not benefit from the Republican tax cut.
Read More Leer más Join the discussion Participa en la discusión


