


In an editorial on President Obama’s proposed bank tax, the Washington Post claimed that the country made a profit on its TARP loans. This claim is only true if we consider the interest on a below market loan to be a profit.
The TARP involved loans of hundreds of billions of dollars to banks at interest rates that were far below what they would have been forced to make in the market at the time. The Fed lent far more money to the banks through its special lending facilities.
The access to trillions of dollars of loans at below market interest rates in the middle of a financial crisis was enormously valuable to the banks allowing many to survive that would have otherwise have been insolvent. Arguably, this was the best policy for the economy, since it prevented a full-scale financial collapse that would have led to an even larger economic downturn and more unemployment. However it is absurd to pretend that the taxpayers did not give large subsidies to the banks through these bailouts.
[Addendum: The subhead for this editorial is “Why should banks have to pay for the auto industry bailout?” On this topic, Gary Burtless calls attention to the sentence, “If Treasury faces paper losses on TARP now, it is due in large part to the bailouts of insurance giant AIG, General Motors and General Motors’ erstwhile finance unit, now known as Ally Bank.”
AIG is of course not part of the auto industry. There also is a very specific reason that it needed a government bailout. It had issued hundreds of billions of dollars worth of credit default swaps that it would not have been able to pay off, without the bailout.
And, guess who owned the credit default swaps? Yep, it was the banks.
Read More Leer más Join the discussion Participa en la discusión
In his Economix post today Casey Mulligan asks the question of whether unemployment benefits on net create jobs. He tells readers that:
“Even if unemployment insurance did not discourage a single person from working, the net effect of the program on hiring can be positive or negative, depending on the labor intensity of the goods and services that the unemployed buy, compared with the labor intensity of the goods and services that those who pay for unemployment do not buy.”
There is a problem in this story and it has to do with timing. The people who pay for unemployment insurance (UI) are in fact the same as the people who receive it. It is paid for as deduction from wages. The issue is not a difference in consumption patterns between the payers and receivers, the issue is the timing of the benefits.
At the point in a business cycle where large numbers of people are receiving benefits (like now) the UI system will be running a deficit. This allows unemployed workers to receive benefits, which they will overwhelmingly spend, without an offsetting current payment from other workers. This means that there is no matching deduction from the demand of workers who are still employed.
Over time, there may be offsetting increases in the contribution for unemployment insurance, depending on whether the program is financed in a way that ensures that it is a self-financed system. (We can also have a Ricardian equivalence story whereby other taxes would be increased to make up a shortfall in the UI system.) That can lead to lower consumption at future times.
However, there is not a plausble story whereby workers would reduce consumption today by an amount equal to the additional spending allowed by the payment of unemployment benefits. Therefore we don’t have to investigate the relative labor intensity of the items purchased by UI beneficiaries and non-beneficiaries as Mulligan suggests.
Read More Leer más Join the discussion Participa en la discusión
Ezra Klein’s WonkBlog has an interesting piece asking whether Greece is going to have the dubious honor of having the largest economic downturn in modern history. The piece quotes Uri Dadush, a former World Bank official, who predicts a decline of 25-30 percent, which would beat both Argentina’s 20 percent decline in 1998 to 2002 and Latvia’s 24 percent decline in the current crisis.
The piece is a bit sloppy on one point, saying that Argentina’s decline followed the default on its debt in December of 2001. Actually, the vast majority of the decline preceded the default. Argentina’s economy had already contracted by more than 16 percent by the time of the default. It shrank by around 5 percent following the default before turning around in the second half of 2002.

Source: International Monetary Fund.
This matters in the current context since many people are asking what alternatives Greece has to following the austerity path being demanded by the IMF, the ECB, and the EU. While there are reasons that a default would be more difficult in Greece’s case than Argentina’s (most importantly Argentina had its own currency), the post-default experience of Argentina suggests that it probably chose the better route.
Ezra Klein’s WonkBlog has an interesting piece asking whether Greece is going to have the dubious honor of having the largest economic downturn in modern history. The piece quotes Uri Dadush, a former World Bank official, who predicts a decline of 25-30 percent, which would beat both Argentina’s 20 percent decline in 1998 to 2002 and Latvia’s 24 percent decline in the current crisis.
The piece is a bit sloppy on one point, saying that Argentina’s decline followed the default on its debt in December of 2001. Actually, the vast majority of the decline preceded the default. Argentina’s economy had already contracted by more than 16 percent by the time of the default. It shrank by around 5 percent following the default before turning around in the second half of 2002.
Source: International Monetary Fund.
This matters in the current context since many people are asking what alternatives Greece has to following the austerity path being demanded by the IMF, the ECB, and the EU. While there are reasons that a default would be more difficult in Greece’s case than Argentina’s (most importantly Argentina had its own currency), the post-default experience of Argentina suggests that it probably chose the better route.
Read More Leer más Join the discussion Participa en la discusión
David Brooks is upset that liberal economists keep harping on the loss of middle class jobs as the main factor behind the disruption of working class families and communities. In expressing his anger he creates a caricature, since there probably is no economist who would claim that the problems of working class people are exclusively their poor employment prospects.
Bad economic prospects lead to a variety of ills that cannot be simply reversed when the economy turns around. This is why many of us left-wing economic types are angry with the Brooks types who think it is just fine if we wait until 2020 to get back to normal levels of employment.
Brooks also has an interesting theory on the loss of skills. He tells readers:
“The American social fabric is now so depleted that even if manufacturing jobs miraculously came back we still would not be producing enough stable, skilled workers to fill them.”
Five years ago we had two million more people employed in manufacturing than we do today. Has the social fabric become so depleted in this period that these people or others could now not fill these jobs if they came back? If Brooks really thinks that the ill effects of unemployment are that extreme he should be screaming for more stimulus in every column.
Read More Leer más Join the discussion Participa en la discusión
Andrew Ross Sorkin has a lengthy discussion of the complexities of the Volcker rule, which bans proprietary trading by banks that hold government guaranteed deposits. The point of the rule is that banks should not be taking risks with taxpayers’ money.
While Sorkin ultimately comes down in favor of the rule, he neglects to point out that until 1999 there was a much stricter rule in the form of the Glass Steagall separation between commercial and investment banking. Up to that point, investment banks like Goldman Sachs and Merill Lynch could do whatever trading they wanted. In principle they were not putting government money at risk, since they did not enjoy protection from the Fed and the FDIC. These banks also made large profits.
If banks now find the Volcker rule to be too onerous, as they claim, then there is no obvious reason they could not just separate their investment banking and commerical banking divisions so that they are again independent companies. It is certainly understandable that the banks would prefer to be able to gamble with taxpayers money (who wouldn’t?), but they really don’t have much of a case.
btw, Sorkin begins his piece with a paean to Volcker:
“It is hard to disagree with Paul A Volcker.
“But I will.
“On Monday, Mr. Volcker, the former Federal Reserve chairman who almost single-handedly rescued the United States from the stagflation crisis of the late 1970s.”
Whether or not one agrees with the interest rate policies that Volcker used to slow inflation, which gave us double digit unemployment, it is a bit hard to describe Volcker as uniquely talented. All wealthy countries saw a sharp decline in their inflation rates at the beginning of the 80s. This suggests that Mr. Volcker’s skills were not needed to bring inflation down.
Read More Leer más Join the discussion Participa en la discusión
Those familiar with economics know that government deficits can help sustain demand in a downturn, keeping GDP from falling and unemployment from rising as much as would otherwise be the case. This could mean that it would be desirable to have large deficits in response to a steep downturn like the one we have seen following the collapse of the housing bubble.
But the NYT doesn’t buy it. A news story on President Obama’s 2013 budget told readers:
“The one charge the White House has no defense against is that with the new budget, Mr. Obama has broken his 2009 promise to cut the deficit in half in his first term. The deficit that year was a record $1.4 trillion. The deficit in fiscal 2012 will total $1.3 trillion.”
The economic downturn was far more severe than what President Obama’s advisers (like most economists) assumed when he made this promise. President Obama and his advisers certainly can be blamed for failing to recognize the severity of the damage that would be caused by the collapse of the housing bubble, even as late as 2009, however most people might consider the worse than expected downturn, kind of a like or a war or enormous natural disaster, to be a pretty good defense here.
Read More Leer más Join the discussion Participa en la discusión
Yes, that was back in 2001 when Greenspan was arguing for the virtues of President Bush’s tax cuts. That concern turned out to be somewhat misplaced. However the inaccuracy of the projections being used at the time, which did show the country paying off its debt inside of a decade, should provide some caution in assessing long-range projections.
The inaccuracy of these projections might cause some to question the wisdom of the Washington Post’s decision to headline a piece on President Obama’s budget:
“Obama budget: National debt will be $1 trillion higher in a decade than forecast.”
An assertion like this implies a level of accuracy in these long-range projections that is not at all justified by their track record. It also would have been helpful to point out that $1 trillion is a bit more than 4.0 percent of projected GDP for 2022.
While this article includes the criticisms of people who feel that President Obama did not go far enough in reducing the deficit in this budget, a balanced piece would have included the comments of some of the many economists who criticize the administration for failing to have sufficient stimulus to bring down the unemployment rate more quickly.
Read More Leer más Join the discussion Participa en la discusión
The folks at the Washington Post have worked themselves up into the usual tizzy over the fact that President Obama has not proposed large cuts to Medicare and Social Security in his 2013 budget. In keeping with this spirit over at Fox on 15th Street, Post columnist Dana Milbank thinks he has nailed President Obama on a big increase in his deficit projections since last fall.
Milbank tells readers:
“The Washington Post’s Lori Montgomery asked why the projected debt had swelled by $1 trillion since September. Zients spoke about ‘differences in economic assumptions.’
But that didn’t hold up, because the Economist’s Greg Ip pointed out that the White House is using an optimistic 3 percent forecast for economic growth this year, higher than the Federal Reserve and private-sector forecasts.”
You can hear the high fives and gotchas down at the Post even up here near the city’s boundaries in 16th Street Heights. It turns out that the Post gang missed their mark, which they would know if anyone there ever did their homework.
Budget projections are made on economic assumptions; what matters is how the assumptions change, not what the economy is actually doing. While the assumptions should reflect the real world, it is only the assumptions that matter. If we look at the assumptions used last September we see that they are in fact quite a bit more optimistic than the assumptions being used in the 2013 budget.
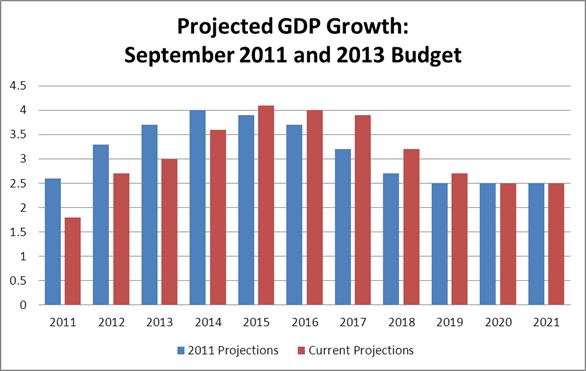
Source: Office of Management and Budget.
Last fall the administration was assuming that the economy would grow by 2.6 percent in 2011 and 3.3 percent in 2012, the current budget assumes 1.8 percent and 2.7 percent, respectively. Projected annual growth in the new projections doesn’t exceed growth in the September projections until 2015. Clearly the slower growth assumptions would imply larger deficits. Whether this could explain the full $1 trillion change would require a more careful examination of all the assumptions used in the projections, but Milbank and the Post’s gotcha doesn’t hold water.
The folks at the Washington Post have worked themselves up into the usual tizzy over the fact that President Obama has not proposed large cuts to Medicare and Social Security in his 2013 budget. In keeping with this spirit over at Fox on 15th Street, Post columnist Dana Milbank thinks he has nailed President Obama on a big increase in his deficit projections since last fall.
Milbank tells readers:
“The Washington Post’s Lori Montgomery asked why the projected debt had swelled by $1 trillion since September. Zients spoke about ‘differences in economic assumptions.’
But that didn’t hold up, because the Economist’s Greg Ip pointed out that the White House is using an optimistic 3 percent forecast for economic growth this year, higher than the Federal Reserve and private-sector forecasts.”
You can hear the high fives and gotchas down at the Post even up here near the city’s boundaries in 16th Street Heights. It turns out that the Post gang missed their mark, which they would know if anyone there ever did their homework.
Budget projections are made on economic assumptions; what matters is how the assumptions change, not what the economy is actually doing. While the assumptions should reflect the real world, it is only the assumptions that matter. If we look at the assumptions used last September we see that they are in fact quite a bit more optimistic than the assumptions being used in the 2013 budget.
Source: Office of Management and Budget.
Last fall the administration was assuming that the economy would grow by 2.6 percent in 2011 and 3.3 percent in 2012, the current budget assumes 1.8 percent and 2.7 percent, respectively. Projected annual growth in the new projections doesn’t exceed growth in the September projections until 2015. Clearly the slower growth assumptions would imply larger deficits. Whether this could explain the full $1 trillion change would require a more careful examination of all the assumptions used in the projections, but Milbank and the Post’s gotcha doesn’t hold water.
Read More Leer más Join the discussion Participa en la discusión
ABC News took budget reporting to new levels of irresponsibility last night telling its viewers to think of the federal budget like the family budget by knocking off 8 zeros to make spending $38,000, instead of $3.8 trillion. While this approach could be useful to put some items in context (spending on TANF, the main welfare program, would be around $190; the $1 million Woodstock museum that served as a main prop for John McCain’s presidential campaign would cost 1 cent), it is fundamentally misleading in explaining the significance of the deficit and debt.
Unlike ABC’s family, the government is expecting to be around in perpetuity. This means that it never has to pay off its debt. At the least, it would be more appropriate to make a comparison to a corporation, which may forever add to its debt as it grows. No shareholder would complain if General Electric borrowed a huge amount of money to expand a profitable division. Government spending fosters growth by financing education, infrastructure and other public investments which will make the country richer in the future.
However, there are even more fundamental differences between the government and a family. The U.S. government’s debt is in notes printed by the government. If ABC wants to make the family analogy, its family has an obligation to pay off the $9,000 it has borrowed in 9000 sheets of paper that say “I owe you $1, payable in notes that say ‘I owe you a note saying that I owe you a note’.”
Most families can’t borrow on such terms, but the government can and does. If ABC can’t explain this distinction in its 2 minute and 30 second news segment, then it should look for a different analogy.
Finally, the government has the responsibility to support the private economy. The collapse of the $8 trillion housing bubble (which ABC News neglected to tell its viewers about as it was growing) left a gap in annual demand of close to $1.4 trillion.
When the bubble burst annual spending on residential construction fell by close to $600. Consumption, which had been fueled by housing bubble generated equity, fell by close to $500 billion. The collapse of a bubble in non-residential real estate led to a fall off in this sector of close to $150 billion. And, cutbacks in state and local spending, forced by the decline in tax revenue, reduced annual demand by another $150 billion.
It would be wonderful if private sector demand would spring up and replace this lost demand, but the world doesn’t work this way. If the government were to quickly cut back its deficit it would lead to lower output and higher unemployment.
To make the family analogy, suppose that the family’s spending was responsible for keeping the local butcher, barber, and doctor in business. If the family decided to stop using its credit card, one or more of these businesses would go under.
If ABC wanted to do honest reporting on the budget, it would have crafted its family analogy along these lines.
One last point, ABC said that President Obama broke a promise by not cutting the deficit in half. It would have been useful to point out that the downturn was far more severe than President Obama, and most private economists, expected at the time he made this promise. This is the main reason that the deficits have not followed the course that expected.
Read More Leer más Join the discussion Participa en la discusión
The NYT had an article reporting on the rebuilding following last year’s earthquake and tsunami in Japan. The article is devoted to what it describes as a generational conflict where older residents wanted even the smallest villages rebuilt whereas many younger residents preferred to save money by consolidating some of the smaller villages into large ones.
At one point the piece describes the rebuilding as a boon to “politically connected” construction companies. It would have been helpful to include more discussion of the impact of these construction companies on the rebuilding process. The more money is spent, the more they would stand to profit. For this reason, it seems likely that they would be opposed to plans to save money by consolidating villages. It would be interesting to know the extent to which they played a role — as oppose to older citizens — in pushing the decision to rebuild all the villages.
Read More Leer más Join the discussion Participa en la discusión


