


When the Mets were an expansion team in 1962 and on their way to losing a record 120 games, their manager Casey Stengel reportedly cried out in frustration after a Mets error, “can’t anybody here play this game?” Readers of the coverage of the 4th quarter GDP report must have felt the same way.
Most of the coverage was along the same lines as the Washington Post headline, “U.S. Economic Recovery Picks Up Pace.” At the most basic level, this is true. GDP grew at a 2.8 percent annual rate, up from 1.8 percent in the third quarter and its strongest showing since the second quarter of 2010. However a closer examination of the data indicated that there was little cause for celebration.
There are always a number of random factors that will affect measured GDP in any given quarter. Often they average out so that the measured GDP is pretty much in line with what we may view as the underlying rate of growth. Sometimes they don’t average out so that the headline number might be notably better or worse than the economy’s underlying growth rate. This is the situation for the last two quarters.
The most obvious wildcard in GDP numbers is inventory changes. These are erratic. Sometimes they reflect conscious decisions of firms to build-up or run-down inventories. Sometimes firms accumulate inventories because they didn’t sell as much as expected. Sometimes it is just the timing of when items get counted in stock.
Whatever the cause, inventory fluctuations often have a very large impact on GDP growth. And, this impact is often reversed in the following quarter. (The impact on growth is the change in the change. If inventories grow by $50 billion in both the third and fourth quarters then inventories add zero to growth. The $50 billion growth in inventories only boosts growth in the fourth quarter if we added less than $50 billion in the third quarter.)
This is worth noting because more than the entire difference between the third quarter growth rate and the fourth quarter growth rate can be explained by the movement in inventories. Inventories subtracted 1.35 percentage points from growth in the third quarter, when they rose at just a $5.5 billion annual rate. They added 1.95 percentage points to growth in the fourth quarter when they rose at a strong $63.6 billion annual rate.
Needless to say, this speedup in the rate of inventory accumulation will not continue. In future quarters inventories are likely to grow at a somewhat slower pace. In the absence of this inventory growth we would have been looking at 0.9 percent growth rate in the fourth quarter.
Fortunately, there were a couple of items on the other side which will certainly not be repeated. Defense spending fell at a 12.5 percent annual rate, lopping 0.73 percentage points off growth for the quarter. Defense spending is heading downward with the winding down of the wars in Iraq and Afghanistan, but certainly not at 12.5 percent annual rate. This just reflects the erratic timing of defense expenditures.
Similarly the category of housing and utilities showed a sharp drop in the quarter, reducing growth by 0.4 percentage points. This is a measure of the rental value of housing, it can only fall if fewer homes are occupied. The likely cause of the sharp drop was better than usual weather, which means less spending on utilities. This drop will almost certainly be reversed in the first quarter of 2012.
However, there is one more negative in the picture. Car sales grew at a 48.1 percent annual rate, adding 0.81 percentage points to growth in the quarter. This was largely a reversal of a decline earlier in the year that resulted from shortages due to the earthquake in Japan. It is not going to be repeated. Car sales will add much less to growth in 2012.
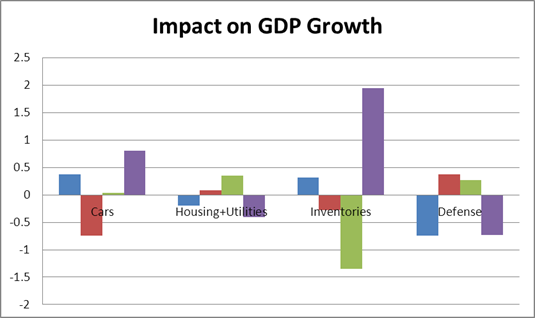
Source: Bureau of Economic Analysis.
The long and short is that there was likely little change in the underlying rate of growth from the third quarter to the fourth quarter. The winding down of the stimulus, coupled with the negative impact from the Japan earthquake brought growth to a near halt in the first half of the year.
Now that the stimulus has almost fully unwound we are back on a growth path of around 2.5 percent — pretty much the economy’s trend rate of growth. This means that we are making up little or none of the ground lost during the recession. That is a really bad story.
When the Mets were an expansion team in 1962 and on their way to losing a record 120 games, their manager Casey Stengel reportedly cried out in frustration after a Mets error, “can’t anybody here play this game?” Readers of the coverage of the 4th quarter GDP report must have felt the same way.
Most of the coverage was along the same lines as the Washington Post headline, “U.S. Economic Recovery Picks Up Pace.” At the most basic level, this is true. GDP grew at a 2.8 percent annual rate, up from 1.8 percent in the third quarter and its strongest showing since the second quarter of 2010. However a closer examination of the data indicated that there was little cause for celebration.
There are always a number of random factors that will affect measured GDP in any given quarter. Often they average out so that the measured GDP is pretty much in line with what we may view as the underlying rate of growth. Sometimes they don’t average out so that the headline number might be notably better or worse than the economy’s underlying growth rate. This is the situation for the last two quarters.
The most obvious wildcard in GDP numbers is inventory changes. These are erratic. Sometimes they reflect conscious decisions of firms to build-up or run-down inventories. Sometimes firms accumulate inventories because they didn’t sell as much as expected. Sometimes it is just the timing of when items get counted in stock.
Whatever the cause, inventory fluctuations often have a very large impact on GDP growth. And, this impact is often reversed in the following quarter. (The impact on growth is the change in the change. If inventories grow by $50 billion in both the third and fourth quarters then inventories add zero to growth. The $50 billion growth in inventories only boosts growth in the fourth quarter if we added less than $50 billion in the third quarter.)
This is worth noting because more than the entire difference between the third quarter growth rate and the fourth quarter growth rate can be explained by the movement in inventories. Inventories subtracted 1.35 percentage points from growth in the third quarter, when they rose at just a $5.5 billion annual rate. They added 1.95 percentage points to growth in the fourth quarter when they rose at a strong $63.6 billion annual rate.
Needless to say, this speedup in the rate of inventory accumulation will not continue. In future quarters inventories are likely to grow at a somewhat slower pace. In the absence of this inventory growth we would have been looking at 0.9 percent growth rate in the fourth quarter.
Fortunately, there were a couple of items on the other side which will certainly not be repeated. Defense spending fell at a 12.5 percent annual rate, lopping 0.73 percentage points off growth for the quarter. Defense spending is heading downward with the winding down of the wars in Iraq and Afghanistan, but certainly not at 12.5 percent annual rate. This just reflects the erratic timing of defense expenditures.
Similarly the category of housing and utilities showed a sharp drop in the quarter, reducing growth by 0.4 percentage points. This is a measure of the rental value of housing, it can only fall if fewer homes are occupied. The likely cause of the sharp drop was better than usual weather, which means less spending on utilities. This drop will almost certainly be reversed in the first quarter of 2012.
However, there is one more negative in the picture. Car sales grew at a 48.1 percent annual rate, adding 0.81 percentage points to growth in the quarter. This was largely a reversal of a decline earlier in the year that resulted from shortages due to the earthquake in Japan. It is not going to be repeated. Car sales will add much less to growth in 2012.
Source: Bureau of Economic Analysis.
The long and short is that there was likely little change in the underlying rate of growth from the third quarter to the fourth quarter. The winding down of the stimulus, coupled with the negative impact from the Japan earthquake brought growth to a near halt in the first half of the year.
Now that the stimulus has almost fully unwound we are back on a growth path of around 2.5 percent — pretty much the economy’s trend rate of growth. This means that we are making up little or none of the ground lost during the recession. That is a really bad story.
Read More Leer más Join the discussion Participa en la discusión
Yes, they noticed the role of inventories. It is still possible to find workers with the necessary skills in the United States.
Yes, they noticed the role of inventories. It is still possible to find workers with the necessary skills in the United States.
Read More Leer más Join the discussion Participa en la discusión
The Washington Post tells us that Congress is considering a transportation bill that will spend $260 billion over the next five years. It would have been helpful to tell readers that this is equal to roughly 1.3 percent of projected spending over this period. It is a bit more than 3.7 percent of projected discretionary spending over this period.
The Washington Post tells us that Congress is considering a transportation bill that will spend $260 billion over the next five years. It would have been helpful to tell readers that this is equal to roughly 1.3 percent of projected spending over this period. It is a bit more than 3.7 percent of projected discretionary spending over this period.
Read More Leer más Join the discussion Participa en la discusión
The Post devoted a business section article to Newt Gingrich’s supply side economics. It would have been useful to note the findings of the research on this topic, for example this Congressional Budget Office study. It found that even in a best case scenario the additional growth sparked by a tax cut could replace less than a third of the lost tax revenue. Even this effect would be temporary, with slower growth in later years implying larger deficits.
The Post should not just throw Gingrich’s assertions out to readers as though they might be true. There is extensive research on this topic which the Post’s business reporters should be familiar with – its readers almost certainly are not.
Read More Leer más Join the discussion Participa en la discusión
In a NYT column on inequality and fairness, Stanley Fish told readers:
“Americans don’t mind if income is redistributed as long as it is done by market forces and not the government. Income equality is fine if it is ‘naturally’ achieved, but if it is socially engineered it can be perceived as class warfare, a plot against the well-to-do.”
Three paragraphs later he poses the rhetorical question:
“Is it fair that Internet pirates in China can appropriate without paying for it the intellectual property of Americans who rely for their income on ideas they have copyrighted?”
The problem here is that copyright is social engineering. It is a government policy that redistributes money from the rest of us to the likes of Time-Warner, Disney, and Lady Gaga. The overwhelming majority of revenue raised through the copyright system goes to the entertainment corporations and a very small number of individuals. The vast majority of creative workers make little or nothing through the copyright system.
It is necessary to finance creative work, but copyright is an extremely inefficient tool for this purpose. (Here’s one alternative.) It creates an enormous gap between the price and marginal cost of a product. Economists usually get upset when a tariff or other trade barrier raises the gap between price and marginal cost by 10-20 percent. In this case, items that would be free without a copyright monopoly, instead can be quite costly. This implies enormous economic losses.
In addition the enforcement of copyright is extremely expensive, especially in the Internet Age. The difficulties of enforcing this archaic system is the motive behind bills like SOPA, which would have imposed enormous costs on intermediaries to ensure that they were not being used to transfer unauthorized copies of copyrighted material.
It is also striking that Fish makes the reference to copyright specifically in regard to China’s respect for U.S. copyrights. This is noteworthy because the demand for China to respect U.S. intellectual property comes to some extent as a trade-off for raising the value of its currency against the dollar.
China clearly will not give the United States everything that may be on its wish list when they negotiate. This means that the more concessions it gets in an area like respecting intellectual property, the less it will get in other areas, like raising the value of the yuan against the dollar. This is directly related to inequality, since a sharp rise in the value of the yuan would lead to many more manufacturing jobs in the United States, which in turn would increase employment opportunities and wage growth for non-college educated workers.
In short, the example that Fish wants to give as a case of fairness — China should respect U.S. intellectual property claims — is actually the opposite on closer inspection. It is one of the ways in which government policy is social engineering designed to redistribute income upward.
[Thanks to Keane Bhatt for this one.]
Read More Leer más Join the discussion Participa en la discusión
The Washington Post reported on the Obama administration’s plans to cut the military budget. It reports that the administration plans cuts of $487 billion over the next decade, but warns that the cuts could be as large as $600 billion.
It is unlikely that many readers would have the ability to assess the significance of cuts of this magnitude since few know how much the country is expected to spend on the military over this period. The baseline projections show that the government will spend roughly $8 trillion on the military over the decade. This means that the cuts proposed by the Obama administration come to a bit more than 6 percent of projected spending over this period. Six hundred billion in cuts would amount to roughly 7.5 percent of projected spending. It is worth noting that even under the larger package of cuts, we would still be spending a larger share of GDP on the military than we did in 2000.
Read More Leer más Join the discussion Participa en la discusión
In an article that told readers of the Fed’s plans to keep its zero interest rate policy through 2014 the NYT commented:
“there is growing criticism that the Fed’s policies are unfairly taking money from savers, including many seniors who planned their retirements around the interest rates that low-risk assets like bank deposits used to pay.”
It would have been worth pointing out that one of the goals of this low interest rate policy is to get savers out of low risk assets and into something like stock that can provide a higher yield and also potentially give money to firms that are looking to raise money for investment. If a retiree has $100-200k in bank accounts, it is a fairly simple matter to shift $10-$20k into a low-cost stock index fund. This would imply some increase in risk for the saver, but it could mean much higher returns.
Read More Leer más Join the discussion Participa en la discusión
The NYT reported that Indiana’s legislature approved a measure that requires that the workers who support a union at the workplace pay for the representation of the workers who choose not to pay for the union’s representation. It would have been helpful to remind readers that a union is legally obligated to represent all the workers in a bargaining unit, regardless of whether a worker has opted to join the union.
This means that non-members not only get the same wages and benefits that the union gets for its members, they also are entitled to the union’s protection in the event of disputes with the employer. Most states allow workers to sign contracts that require non-union members to pay for the benefits they receive from the union.
The bill passed by Indiana’s legislature prohibits unions and employers from signing this sort of contract. Instead, it requires unions to provide free representation to non-members.
Read More Leer más Join the discussion Participa en la discusión
The NYT reported on state efforts to collect sales tax on Internet sales. It reported the complaints of businesses about this practice including that of one business owner that:
“It’s not collecting sales tax that’s the hard part; paying taxes in the jurisdictions is an accounting nightmare.”
It would have been helpful to point out to readers that this is not true. There are companies that can do this for firms at a relatively low cost (similar to payroll companies). There is also low-cost software available to firms that would allow them to calculate the taxes themselves.
Read More Leer más Join the discussion Participa en la discusión
The print edition gave the headline, “they squabble: he rescues the economy,” to a Dana Milbank column on Federal Reserve Chairman Ben Bernanke’s loose money policies. Milbank’s point is that Bernanke has clearly been shown to be right in having relatively expansionary monetary policies, as opposed to Republican critics who complained that this was debasing the currency and would trigger massive inflation.
However the notion of Bernanke and the Fed rescuing the economy would seem to require a bit of qualification. After it, it as Bernanke and the Fed who ignored the growth of the housing bubble until it grew so large that it eventually imploded and took the economy with it.
This is sort of like a doctor who misses the huge cancerous tumor growing out of a patient’s forehead during a check-up. If he later performs the surgery that removes the tumor successfully, that could be said to save the patient’s life, but it would be a bit of a stretch to give the doctor credit for rescuing the patient.
Even after the collapse the Fed has arguably been too limited in its response. When he was still a professor at Princeton Bernanke argued that Japan’s central bank should deliberately target a higher rate of inflation (e.g. 3-4 percent) in order to reduce real interest rates further and thereby spur growth. Bernanke has been unable or unwilling to follow his own advice as Fed chair.
As a result of weak Fed policy, inadequate stimulus, and an over-valued dollar the economy remains horribly depressed four full years after the beginning of the recession. The first President Bush was booted from office due to an economy that looks fantastic compared to the one we have today.
Read More Leer más Join the discussion Participa en la discusión


