


Read More Leer más Join the discussion Participa en la discusión
Donald Trump has made a big show of saying that because he is such a rich guy, he will donate back his presidential salary of $400,000 a year to the government. He regularly tells us which department or agency is the lucky beneficiary of his quarterly compensation.
Unfortunately, he feels no compunction about imposing extraordinary travel and security costs on the government by spending frequent weekends at his Mar-a-Lago resort or other Trump properties. This expense substantially exceeds the $400,000 that the government gets from him donating his salary, as shown in the figure below.
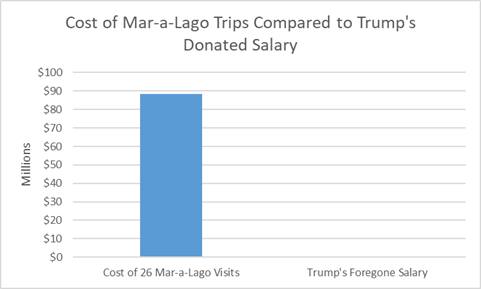
Source: Government Accountability Office and author’s calculations.
The chart relies on a GAO study that calculated that four Trump visits cost the government $13.6 million in extra expenses, or $3.4 million per weekend. The calculation in the graph assumes that he makes 26 trips a year, one every other week.
Donald Trump has made a big show of saying that because he is such a rich guy, he will donate back his presidential salary of $400,000 a year to the government. He regularly tells us which department or agency is the lucky beneficiary of his quarterly compensation.
Unfortunately, he feels no compunction about imposing extraordinary travel and security costs on the government by spending frequent weekends at his Mar-a-Lago resort or other Trump properties. This expense substantially exceeds the $400,000 that the government gets from him donating his salary, as shown in the figure below.
Source: Government Accountability Office and author’s calculations.
The chart relies on a GAO study that calculated that four Trump visits cost the government $13.6 million in extra expenses, or $3.4 million per weekend. The calculation in the graph assumes that he makes 26 trips a year, one every other week.
Read More Leer más Join the discussion Participa en la discusión
I suppose it’s hard for people in Washington to get data from the Washington-based International Monetary Fund, otherwise, they would not tell people things like China is the world’s second-largest economy, after the United States. Using purchasing power parity data, which is what most economists would view as the best measure for international comparisons, China’s GDP exceeded the U.S. GDP in 2015. It is now more than 25 percent larger.
I suppose it’s hard for people in Washington to get data from the Washington-based International Monetary Fund, otherwise, they would not tell people things like China is the world’s second-largest economy, after the United States. Using purchasing power parity data, which is what most economists would view as the best measure for international comparisons, China’s GDP exceeded the U.S. GDP in 2015. It is now more than 25 percent larger.
Read More Leer más Join the discussion Participa en la discusión
The Bureau of Labor Statistics reported that productivity increased at a 3.6 percent annual rate and is now up 2.4 percent over the last year. This is a big improvement from its 1.3 percent average growth rate since 2005.
This is very good news, if it proves to be real and is sustained. It would mean that we can have more rapid improvements in living standards and have more resources for things like a Green New Deal and Medicare for All. But folks should probably hold the celebration, for now, it is very possible that this figure is a fluke since productivity data are subject to large revisions and are extremely erratic. (Arguing for the fluke story, self-employment was reported as dropping at more than a 7.0 percent annual rate in the first quarter. That’s possible, but not very likely. Fewer self-employed means fewer hours, and therefore higher productivity.)
Needless to say, the Trumpers were quick to take credit. The Wall Street Journal told readers:
“The recent gains could be a sign that an uptick in investment following tax-law changes passed in 2017 means businesses are spending on the technology and tools necessary to increase output. Some firms have turned to automation—from factory machines to shelf-scanning robots—to ramp up output while growing hours or payrolls more slowly.”
The piece then quotes Kevin Hassett, the head of Trump’s Council of Economic Advisers:
“The machines people bought last year, they are turning them on this year.”
This story doesn’t make any sense since there was no tax cut induced investment boom in 2018. Investment in the first quarter of 2019 was 4.8 percent higher than in the first quarter of 2018. That is pretty much average growth and certainly not an investment boom.
There were many previous periods with much more rapid investment growth and no corresponding uptick in productivity. For example, investment grew 8.0 percent from the third quarter of 2013 to the third quarter of 2014. It grew 12.9 percent from the first quarter of 2011 to the first quarter of 2012. In neither case was there any notable uptick in productivity growth.
To see a one percentage point increase in the rate of productivity growth, we would need a jump in investment in the neighborhood of 30 percent. The Hassett story is simply not plausible on its face. The article should have made this fact clear to readers.
Read More Leer más Join the discussion Participa en la discusión
The New York Times had a piece describing the quality control issues that Boeing seems to be having at its plant in South Carolina. It would have been worth mentioning that Boeing moved operations from Seattle, where it has an experienced unionized workforce, to South Carolina to take advantage of lower-paid non-union labor. This could have something to do with its quality control problems.
Addendum
The NYT did a very good story last month on the South Carolina plant that pointed out the decision to go with a less experienced non-union workforce.
Read More Leer más Join the discussion Participa en la discusión
Moore said it would take the form of “the biggest sell-off in the stock market in American history.” Since stock is overwhelmingly held by the wealthy, if the market plunges, it means that the wealthy will have relatively less wealth.
It is important to remember that the stock market in principle represents the value of future after-tax corporate profits. This means that any measure that should increase after-tax profits, such as the Republicans’ corporate tax cut, should lead to a rise in the stock market. By contrast, measures that reduce corporate profits, like reining in abusive insurers or taxing fossil fuel companies for the damage they cause to the environment, will lead a fall in the stock market.
While this would mean that rich people would have less money, it has little to do with the health of the economy.
Read More Leer más Join the discussion Participa en la discusión
I asked that question about Washington Post reporters about a year ago, it turns out I have to ask the same question about New York Times reporters. It turns out it comes up in the exact same context, an effort to blame Trump’s trade war for the plight of U.S. farmers.
The issue here is a very simple one that is completely non-controversial among economists. Other things equal, a dollar that has a higher value in currency markets will mean lower prices for U.S. farmers. The logic on this one is straightforward.
Suppose that milk sells in Europe for 2.5 euros a gallon. If there are 1.2 dollars to a euro, then a U.S. dairy farmer will get $3.00 for a gallon of milk sold in Europe. Now suppose the dollar rises in value so that it a euro is only worth 1.0 dollars. In this case, the U.S. dairy farmer will only get $2.50 for a gallon of milk sold in Europe. In the real world, things will always be a bit more complicated, but that basic logic still holds, a higher valued dollar means lower farm prices measured in dollars.
For this reason, it is mind-boggling that the NYT could tell us “the price of milk has dropped by roughly a third in the last five years,” without mentioning that the trade-weighted value of the dollar has risen by more than 20 percent over this period.
There are lots of very good reasons not to like Donald Trump and his trade policy, but the NYT shouldn’t be in the business of making stuff up.
Read More Leer más Join the discussion Participa en la discusión
Read More Leer más Join the discussion Participa en la discusión
I’m just asking because that’s what the Washington Post told readers in an article on the 2019 Social Security and Medicare Trustees reports. The piece noted that the Medicare program is first projected to face a shortfall in 2026. It would take an increase in the payroll tax of 0.91 percentage points (0.455 percentage points on both employees and employers) to fill the projected gap. The piece tells readers this is “a measure that could hurt business development and growth.”
It’s not clear why it would have such a negative effect on business development and growth. The conventional view in economics is that the worker pays this tax out of their wages, so essentially it means that after-wages will be 0.91 percent lower with the tax increase. While that will moderately reduce the incentive to work, most studies show this should have little effect on employment.
We have seen much larger tax increases in prior decades, for example the payroll tax rose by 4.8 percentage points from 1959 to 1969, with little obvious negative effect. It is also worth noting that the slower pace of health care cost growth over the last decade has slowed or even reversed the rise in the percentage of compensation going to health insurance. This means that wages have risen more rapidly than if health care costs had continued to grow at their prior pace. In its impact on the labor market this is equivalent to a cut in the payroll tax. The impact of this slower health care growth over the last decade has been considerably larger than the 0.91 tax increase that is projected to be necessary to fund Medicare after 2026.
Read More Leer más Join the discussion Participa en la discusión
Read More Leer más Join the discussion Participa en la discusión


