Article
The Federal Reserve Bank of Kansas City is now hosting its annual meeting of central bankers in Jackson Hole, Wyoming. The topic of the meeting’s symposium this year is “Inflation Dynamics and Monetary Policy,” addressing the inflation side of the Fed’s dual mandate to maintain high levels of employment and keep inflation low.
The Fed has recently been signaling that it may raise the federal funds interest rate, or the rate financial institutions use to lend to each other. This rate has been close to zero since the beginning of the Great Recession (the 2007–2009 recession) in order to encourage the expansion of the economy. Raising this rate slows down the economy because rates for mortgages and car loans, for example, tend to follow this short-term interest rate. This will reduce inflationary pressure but will also cost jobs and weaken the labor market.
While the official unemployment rate of 5.3 percent seems reasonably low, there is reason to believe this measure understates the weakness of the labor market. This is because workers left the labor force during and after the end of the Great Recession. The exit of these workers counterintuitively causes the unemployment rate to decline. But other measures of the labor market, like the employment-to-population (EPOP) ratio, is evidence that the labor market is persistently weak. In fact, the EPOP ratio for prime-age workers (workers aged 25 to 54) was still down by 2.6 percentage points since the beginning of the recession in 2007.
Another way to visualize the weakness of the labor market is to look at the severity of past recessions and the degree to which they recovered after a certain amount of time, and compare it to the Great Recession. The chart below shows us the change EPOP ratio (horizontal axis) and the change in unemployment rate (vertical axis) for prime-age men in the Great Recession. Prime-age data for men is analyzed because there was a broad trend of women joining the labor force in the 1980s and 1990s. This trend would dampen the observed effects of recessions, so limiting the analysis in this post to only men provides better and more comparable information.
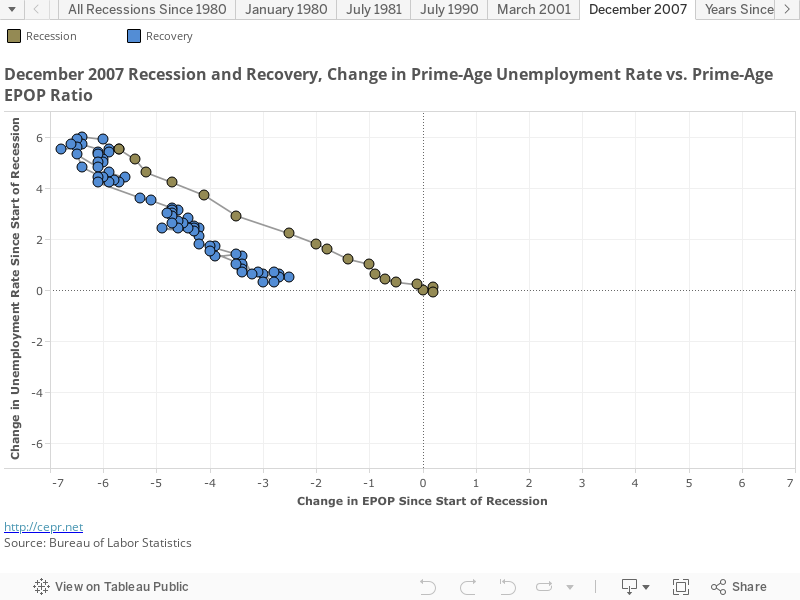
The chart shows the EPOP ratio and the unemployment rate worsening during the recession. The EPOP ratio declines and the unemployment rate increases, so the plot moves up and to the left. During the recovery period, the unemployment rate nears complete recovery (the plot is almost at the horizontal axis), but the EPOP ratio is still nowhere near recovery (the vertical axis).
How does this compare to other recessions? The chart below shows the complete recession and recovery cycle for each recession since 1980, including recessions in 1980, 1981, 1990, 2001, and the Great Recession in 2007. (Select the year of the recession in the chart to highlight its data.)
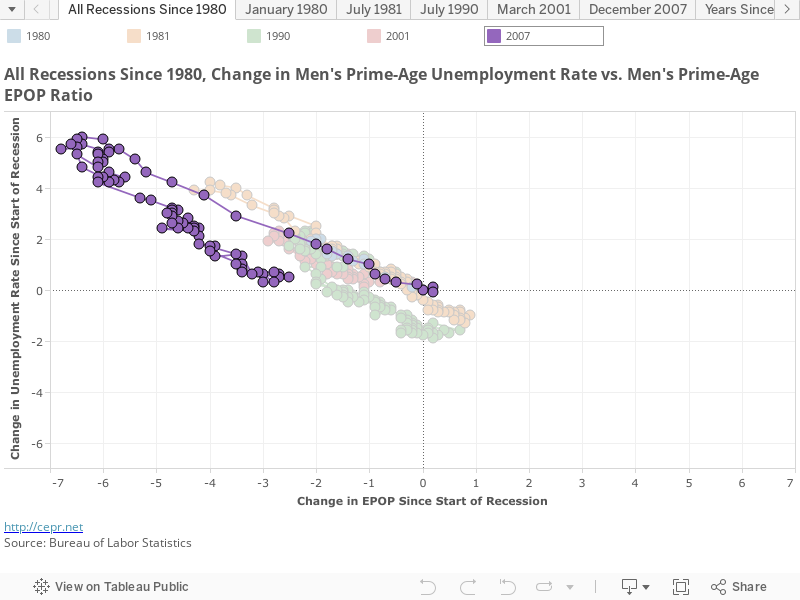
There are three striking observations from this comparison. The first is that the Great Recession was, by far, the most severe recession of all recessions analyzed. At its nadir, the prime-age unemployment rate for men increased by over six percentage points, and the EPOP ratio declined by nearly seven percentage points. This is significantly more than the next-worst recession, the 1981 recession, when the EPOP ratio and unemployment rate lost just over four percentage points at their respective worst points.
The second observation is that current EPOP ratio is very low, still down three percentage points from its pre-recession level. Well over seven years after the beginning of the Great Recession, and six years into the recovery, it is equivalent to the worst periods of the 1990 and 2001 recessions. It is even lower than the low point of 1980 recession.
The last observation is that in the 1990, 2001, and 2007 recessions, the unemployment rate recovered much faster than the EPOP ratio. This suggests that if the unemployment rate is used to assess the conditions of these labor markets by itself, it will overstate their recovery. It also might suggest that expansionary policy is abandoned too soon into these business cycles. For example, the EPOP ratio never recovered in the 2001 recession, and the recovery of the EPOP ratio for the 1990 recession does not occur until the dot-com bubble in the early 2000s, or nearly ten years after the beginning of that recession.
To highlight the severe degree of the Great Recession, below is a year-by-year time series of the same chart of the 1981, 1990, 2001, and 2007 recessions. (Use the arrows to advance the chart by year to compare the status of the labor market in the years after each recession. This chart excludes the 1980 recession because of its short duration.)
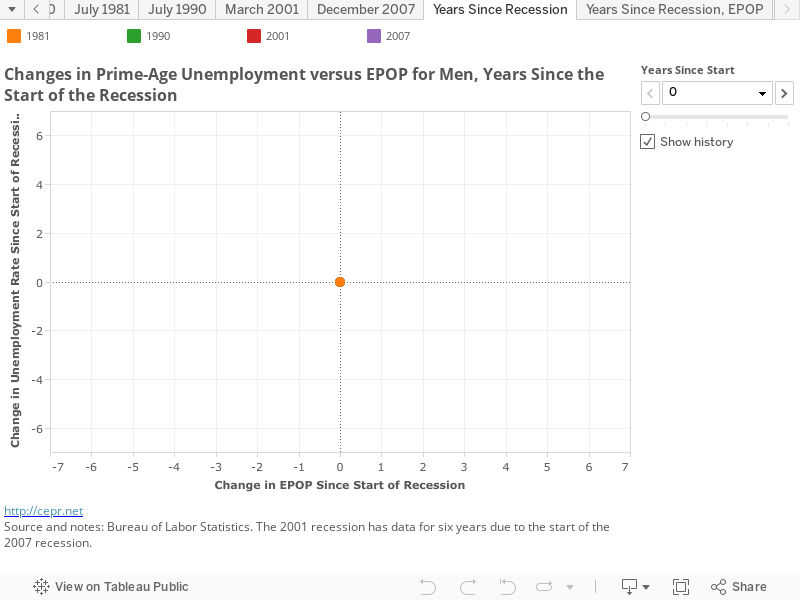
This time series indicates that, seven years after the start of these recessions, the recovery of the EPOP ratio and the unemployment rate was complete or closer to complete for every recession except the Great Recession. Again, it shows that the EPOP ratio is as weak now as it was during the worst years of the other recessions.
Since the Fed wouldn’t consider raising interest rates at the worst points in the 1990 or 2001 recessions, raising interest rates now may not be a wise path.
FedWatch is a semi-monthly online publication of the Center for Economic and Policy Research (CEPR) providing analysis by Dean Baker and colleagues of issues related to the pending Federal Reserve decision on interest rates.