Article
Last month, the Census Bureau released its annual report on income and poverty in the United States. The report indicated that although lower- and middle-income Americans had seen significant income growth in 2015, those at the top of the income distribution had seen the strongest growth over the past forty years.
The Census Bureau’s most widely-cited statistics on inequality come from data on household income. Various commentators have questioned the validity of citing household income, arguing that the definition of “household” doesn’t take into account differences in factors such as family size. If this is true, it could mean that the rise of economic inequality is more of a statistical aberration than a real phenomenon.
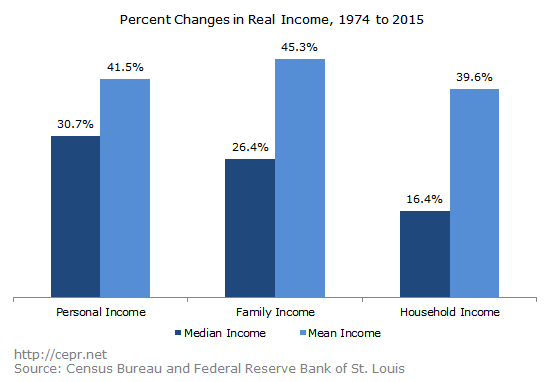
The figure below shows that this is not the case. The Census Bureau publishes three measures of income — personal income, family income, and household income. (The difference between “households” and “families” is that two or more people living in the same residence form a “household” even if they are not members of the same family.) No matter how you toy with the precise definition of income, it’s clear that inequality has gone up: by all three metrics, median income growth failed to keep pace with overall growth from 1974 to 2015. Even the most optimistic measure of median income growth (personal income) grew less slowly than the least optimistic measure of average income growth (household income) over this period. So no matter the definition of “income,” inequality has certainly gone up.