Article
If you listen to enough debates on economic inequality, there is one assertion you are bound to hear from those defending the status quo: the inequality statistics are bunk. Basically, the dramatic increase in economic inequality over the past 40 years is a mirage.
Consider, for example, the frequent assertion about differences in household size. This argument is relatively straightforward: statistics on household income inequality don’t adjust for differences in the number of people per household, and therefore likely overstate economic inequality. For example, $80,000 split between a husband and wife with no children can provide roughly the same standard of living as $40,000 for a single individual; therefore, even if statistics on household inequality show that the first household makes twice as much as the second, there is little to no difference in economic well-being.
However, data released earlier this week from the Census Bureau show that disparities in household size have little impact on measures of economic inequality. Furthermore, to the extent that these disparities do matter, their importance has decreased over time; this means that the rise in economic inequality has actually been more significant than the normal statistics indicate.
The SIPP includes data on both pure money income and equivalence-adjusted income. The latter measure is similar to the former measure, except that it adjusts for differences in household size. It furthermore accounts for the fact that children consume less than adults and that household expenses increase more slowly as families grow larger and larger. (The measure is described more fully on pages 8–9 of the report.) As the Census itself notes, the equivalence adjustment tends to increase the incomes of the poorest Americans and decrease the incomes of the richest Americans:
“Generally, the income shares in the lower quintiles are higher with equivalence-adjusted income than money income while the reverse is true for the higher quintiles. This redistribution would be expected because the lower end of the income distribution has a higher concentration of single-person house-holds and smaller family sizes than those at the upper end of the distribution” (p. 9).
However, the extent of the impact is relatively minor. In 2015, households in the lowest quintile (20 percent) of the income distribution took home just 3.1 percent of national income; their share of equivalence-adjusted income was only slightly higher at 3.4 percent. By contrast, the top five percent of households took home 22.1 percent of total income and 21.8 percent of total equivalence-adjusted income (p. 9).
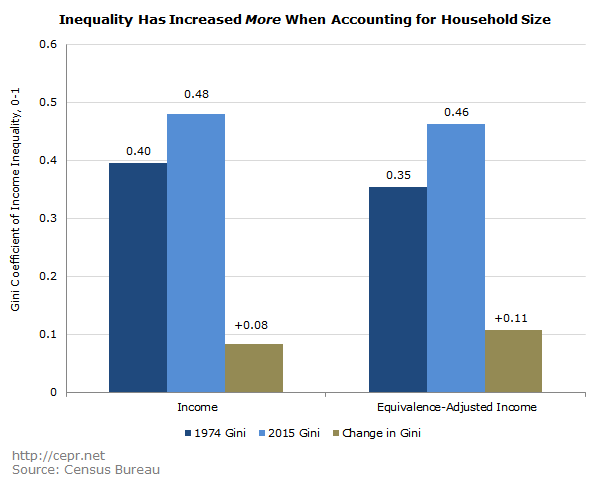
If there was ever a time when differences in household size were important, it was the 1970s. In 1974, the Gini coefficient — the most common measure of economic inequality, which operates on a scale from 0 to 1 (“zero” being an economy in which everyone has an equal income, “one” being a scenario in which a single person commands 100 percent of national income) — was 0.40, compared to a Gini coefficient of 0.35 for equivalence-adjusted income. By 2015, those figures had risen to 0.48 and 0.46, respectively. This means that the increase in inequality has actually been more rather than less pronounced when we account for changes in household size. This can be seen in the figure below:
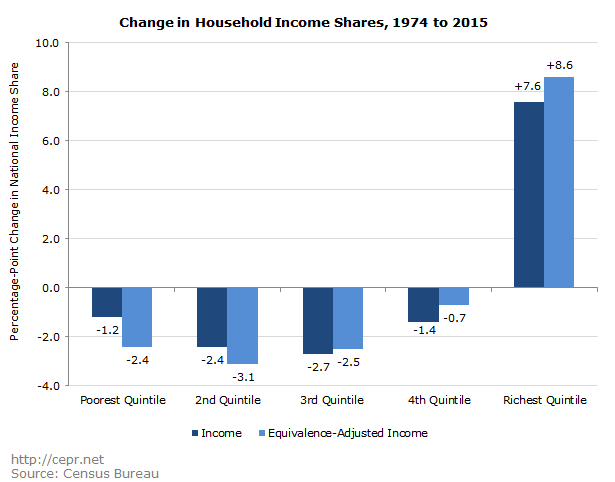
These changes are most apparent along the extremes of the income distribution. While the income share of the bottom 20 percent of households fell 1.2 percentage points between 1974 and 2015 (from 4.3 to 3.1 percent), their share of equivalence-adjusted income fell by 2.4 percentage points. The top fifth of households saw their income share rise from 43.5 to 51.1 percent over the same period, but experienced an even greater increase in equivalence-adjusted income. This is depicted in the figure below:
No matter how the data are sliced, it’s clear that income inequality has gone up substantially over the past 40 years. When changes in household size are considered, the increase appears even more dramatic.