Article
Tomorrow, the Bureau of Labor Statistics (BLS) will release the newest data for the Consumer Price Index (CPI), the most widely cited indicator of consumer inflation. One important measure to watch will be childcare and nursery school, whose costs have risen faster than overall inflation for the past quarter-century.
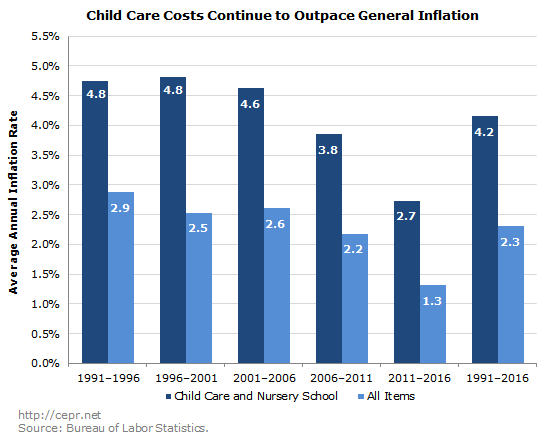
The figure below shows the annual rates of inflation for five different five-year periods from 1991 to present. Between 1991 and 2016, the costs of childcare and nursery school rose 177 percent; by contrast, prices for the economy as a whole have risen just 77 percent. (The figure will be updated to include the latest data in tomorrow’s CEPR Prices Byte.)
Now, for many consumers, this isn’t a significant worry — childcare and nursery school are just 0.7 percent of current consumer spending. However, this 0.7 percent figure represents an average across all consumers, most of whom do not currently have young children.
For parents, the story is quite different. An August 2014 study by the U.S. Department of Agriculture found that a two-parent, middle-income family (those making between $62,000 and $107,000 per year) will spend an average of $245,000 (in 2013 dollars) on their kids between the ages of zero and 17. Moreover, due to rising income inequality, poor families are finding it harder to give their children the same opportunities afforded to rich children. At present, families in the top fifth of the income distribution spend seven times as much on their children as families in the bottom fifth. This inequality can also be observed for paid leave: about 23 percent of workers in the top tenth of the wage distribution have access to paid family leave, compared to just four percent of workers in the bottom tenth.
This discrepancy shows up in a very significant way in children’s early years, when it is most important to invest in their healthcare and education. Between the ages of zero and two, two-parent families making over $107,000 per year will spend about 2.3 times as much on their kids as low-income two-parent families and over 2.6 times as much as low-income single-parent families. (“Low income” in this case means an annual income of less than $62,000 per year; the average low-income two-parent household makes $39,000 per year, while the average single-parent household makes $27,000 per year.) And the rising costs of childcare and early education — which were just two percent of total spending on children in 1960 but had risen to 18 percent by 2013 — have played a big role in creating that inequality. Childcare and early education spending among high-income, two-parent households averages $5,500 per year between the ages of zero and two; for low-income two-parent and single-parent households, those figures come out to just $2,200 and $1,500, respectively.
These striking inequalities have come about largely because the government has failed to provide the type of universal or near-universal paid family leave, preschool, and childcare programs available in most other rich countries. The U.S. is the only developed country without guaranteed paid maternity leave and is one of just eight developed countries without paid paternity leave. (Greece, Italy, and the Netherlands also offer less than one week of paid paternity leave.) Just 53.7 percent of three to four year-olds are enrolled in pre-school, the second-lowest rate in the developed world; for almost all other rich countries, enrollment is above 80 percent, and in France and Israel, it’s 100 percent.
The U.S. could certainly spend more on childcare and early education without breaking the bank. According to the Organisation for Economic Cooperation and Development (OECD), public expenditure on pre-primary education and childcare is just 0.4 percent of GDP in the United States; this is far lower than the rates of spending in Denmark (2.0 percent of GDP) or Iceland and Sweden (1.6 percent). By this measure, the U.S. comes in 33rd out of the 36 countries surveyed by the OECD. Public expenditure on pre-primary education spending is 0.3 percent of GDP in the U.S. but averages 0.5 percent in the other OECD countries; even more shockingly, public expenditure on childcare is just 0.06 percent of GDP, well short of the 0.4 percent average from the rest of the OECD. Nor do differences in GDP make up for the latter gap: in 2011, public expenditure on childcare was $794 per child in the U.S., less than one-third of the OECD average. By contrast, public spending on childcare is $7,100 per child in Finland, $6,400 in Norway and Denmark, $5,900 in Sweden, and $5,700 in Iceland — despite the fact that the U.S. is substantially richer than all those countries except Norway. Finally, in a separate survey, the OECD found that just 14 percent of all public spending on children in the U.S. went to children age five and under — dead last among the 32 OECD countries in the sample.[1]
The lack of public investment pushes the costs of childcare onto households themselves; and while this is problematic for all families, it clearly causes the most hardship for the poor. Unless there are significant changes to U.S. childcare policy, costs will continue to rise, and poor children will fall even further behind their rich peers, slowly chipping away at the idea of American meritocracy.
[1] In the United States, 14 percent of all public spending on children goes to children ages zero to five; 41 percent goes to children ages six to 11; and 45 percent goes to children ages 12 to 17. For the other 31 countries (data were not available for Canada and Turkey), 26 percent of all public spending on children went to children ages zero to five; 35 percent went to children ages six to 11; and 39 percent went to children ages 12 to 17.