

November 26, 2012

State governments spend a lot of money — usually in the form of tax breaks for companies — trying to bring jobs to their states. The problem with this kind of race-to-the-bottom strategy is that the most they can hope to achieve is to shift jobs from one state to another, leaving total national employment unchanged.
When it comes to state employment, the real drivers of success or failure lie almost completely beyond the reach of state governments. The overwhelming determinants of state employment are monetary and fiscal policy, which are set entirely at the federal level.
The chart below helps to illustrate the point. The third and longest bar in the figure shows the unemployment rate in each of the 50 states and the District of Columbia in 2010, the worst year in the labor market in the recent recession. Not only was the overall unemployment rate high (9.6 percent), but the range in unemployment rates across states was large – from under 4 percent in North Dakota, to over 12 percent in California, Michigan, and Nevada.
Click for larger version
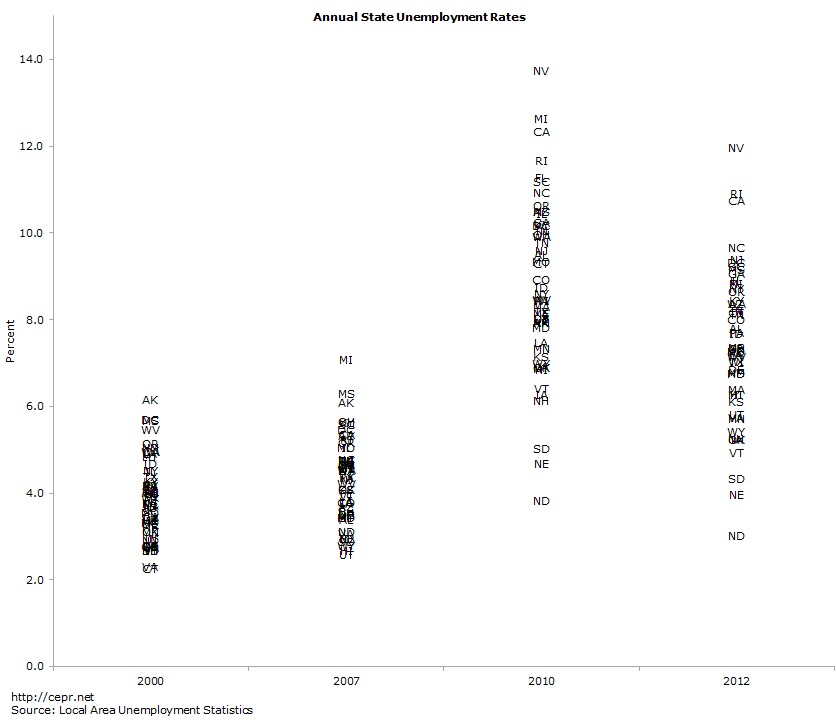
By contrast, when the national unemployment rate was low – as was the case in the labor-market peaks of 2000 (4.0 percent) and 2007 (4.6 percent) – the range of unemployment rates across the states was tight, with only one state above 6 percent in 2000 (Alaska) and only three states above that level in 2007 (Alaska, Mississippi, and Michigan).
A low national unemployment rate – something determined completely by fiscal and monetary policy at the federal level – appears to have a much bigger effect on how individual states fare than any state-level policies. The same states that had very different unemployment rates in 2010, had very similar unemployment rates in 2000 and 2007, independent of the particular state-level employment policies they pursued.
The best thing state governors can do to improve the labor market in their states is to band together to press federal authorities to pursue full employment policies.
Meanwhile, state governments actually do have substantial leverage over the quality of jobs in their states. States can, for example, set minimum wages (as 19 already do), mandate health insurance coverage (as Hawaii does), offer paid family leave (as California and New Jersey do), or require employers to provide paid sick days (as Connecticut will, starting January 1).
|
Annual Unemployment Rate by State for Select Years |
||||
|
2000 |
2007 |
2010 |
2012 |
|
|
Alabama |
4.0 |
3.4 |
9.5 |
7.8 |
|
Alaska |
6.2 |
6.1 |
7.9 |
7.2 |
|
Arizona |
4.1 |
3.7 |
10.5 |
8.4 |
|
Arkansas |
4.2 |
5.3 |
7.9 |
7.3 |
|
California |
5.0 |
5.4 |
12.3 |
10.7 |
|
Colorado |
2.8 |
3.8 |
8.9 |
8.0 |
|
Connecticut |
2.3 |
4.6 |
9.3 |
8.2 |
|
Delaware |
3.3 |
3.5 |
8.0 |
6.9 |
|
District of Columbia |
5.7 |
5.5 |
10.2 |
9.3 |
|
Florida |
3.8 |
4.0 |
11.3 |
8.9 |
|
Georgia |
3.5 |
4.7 |
10.2 |
9.1 |
|
Hawaii |
4.0 |
2.7 |
6.9 |
6.3 |
|
Idaho |
4.7 |
3.0 |
8.8 |
7.7 |
|
Illinois |
4.5 |
5.1 |
10.5 |
8.9 |
|
Indiana |
2.9 |
4.6 |
10.1 |
8.2 |
|
Iowa |
2.8 |
3.8 |
6.3 |
5.2 |
|
Kansas |
3.8 |
4.1 |
7.1 |
6.1 |
|
Kentucky |
4.3 |
5.6 |
10.2 |
8.4 |
|
Louisiana |
4.9 |
3.8 |
7.5 |
7.2 |
|
Maine |
3.3 |
4.7 |
8.2 |
7.4 |
|
Maryland |
3.6 |
3.4 |
7.8 |
6.8 |
|
Massachusetts |
2.7 |
4.5 |
8.3 |
6.4 |
|
Michigan |
3.7 |
7.1 |
12.6 |
8.8 |
|
Minnesota |
3.1 |
4.7 |
7.3 |
5.7 |
|
Mississippi |
5.7 |
6.3 |
10.5 |
9.2 |
|
Missouri |
3.3 |
5.0 |
9.3 |
7.3 |
|
Montana |
4.8 |
3.4 |
6.9 |
6.3 |
|
Nebraska |
2.8 |
3.0 |
4.7 |
4.0 |
|
Nevada |
4.2 |
4.7 |
13.7 |
12.0 |
|
New Hampshire |
2.7 |
3.5 |
6.1 |
5.3 |
|
New Jersey |
3.7 |
4.3 |
9.6 |
9.4 |
|
New Mexico |
5.0 |
3.5 |
7.9 |
6.8 |
|
New York |
4.5 |
4.6 |
8.6 |
8.7 |
|
North Carolina |
3.8 |
4.8 |
10.9 |
9.7 |
|
North Dakota |
2.9 |
3.1 |
3.8 |
3.0 |
|
Ohio |
4.0 |
5.6 |
10.0 |
7.3 |
|
Oklahoma |
3.1 |
4.1 |
6.9 |
5.2 |
|
Oregon |
5.1 |
5.2 |
10.6 |
8.6 |
|
Pennsylvania |
4.2 |
4.4 |
8.4 |
7.7 |
|
Rhode Island |
4.2 |
5.2 |
11.7 |
10.9 |
|
South Carolina |
3.6 |
5.6 |
11.2 |
9.2 |
|
South Dakota |
2.7 |
2.9 |
5.0 |
4.3 |
|
Tennessee |
4.0 |
4.8 |
9.8 |
8.1 |
|
Texas |
4.4 |
4.4 |
8.2 |
7.0 |
|
Utah |
3.4 |
2.6 |
8.0 |
5.8 |
|
Vermont |
2.7 |
3.9 |
6.4 |
4.9 |
|
Virginia |
2.3 |
3.1 |
6.9 |
5.7 |
|
Washington |
5.0 |
4.5 |
9.9 |
8.4 |
|
West Virginia |
5.5 |
4.2 |
8.5 |
7.2 |
|
Wisconsin |
3.4 |
4.8 |
8.5 |
7.0 |
|
Wyoming |
3.9 |
2.8 |
7.0 |
5.4 |
|
United States |
4.0 |
4.6 |
9.6 |
8.2 |
|
Source: Local Area Unemployment Statistics and Current Population Survey. Note: The rates for 2012 are the average of seasonally adjusted data covering the months January to September. |
||||

