September 26, 2012
Casey Mulligan takes another stab at explaining the drop in employment since the housing market crash on changes in incentives in the NYT today. The basic story is that the extension of the length of unemployment insurance (UI), the easing of eligibility rules, the increased generosity of food stamps and several other changes in tax and benefit structures gave people less incentive to work. As a result, more people opted to rely on these benefits rather than work, hence the large falloff in employment and the rise in the unemployment rate.
There are many problems with this story, most importantly that people who have looked at what happens to workers whose UI benefits expire (e.g. Jesse Rothstein) find that most of them simply leave the labor force. They do not suddenly start working. Since the extension of UI benefits was by far the most important change in incentives since the start of the downturn, and we don’t see much evidence of an effect on employment, we might have some reason to believe that the other smaller changes had much effect.
But Mulligan presents us with a graph that shows that groups that saw larger increases in effective tax rates (which includes the loss of benefits from working as an implicit tax) had the biggest falloff in average hours worked.

Source: Mulligan, 2012.
Actually, the graph doesn’t quite show this story. We can see that high-middle skilled unmarried heads of households had an effective reduction in marginal earnings of more than 15 percent, yet they had the same or less reduction in hours than all but the highest skill group among married workers, all of whom had considerable smaller increases in effective marginal tax rates. If Mulligan has a case here, it rests on the lowest skill, low-middle skilled and middle skilled group among unmarried heads of households. (To convince yourself of this fact, cover up these three points and see if the graph tells you anything about the relationship between the drop in hours and the change in effective tax rates.)
There are a couple of points to be made about this analysis. First, we had around 10.5 million employed single heads of households in 2007. This means that we can’t hope to explain too large a share of the 10 million lost jobs in the downturn on this group. The second point is that once we begin to divide this group by skills the samples are not very large. We also run the risk that we are picking up other effects, most notably that these are likely to be younger workers who have had particularly bad employment experiences in the downturn.
But let’s accept Mulligan’s work at face value. Note that his endpoint is 2010. The reason is that benefits became notable less generous after 2010 by his calculations as many programs expired. Depending on the group, a quarter to one-third of the disincentive would have been eliminated. This means that we should expect to see a substantial uptick in hours worked for the most affected groups.
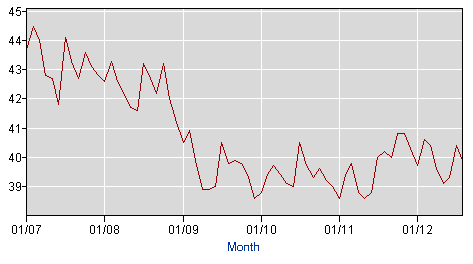
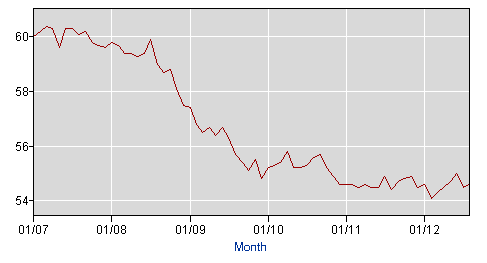
It would take a bit of work to reproduce Mulligan’s skill groups, but if we look at the less-skilled segment of the population, those without high school degrees and those with just high school degrees, it is difficult to see much evidence of a gain in employment since 2010 when the work disincentives were lessened. In other words, if these people didn’t respond to the reduction of disincentives when programs expired, it’s hard to believe that they were responding to the increased disincentive whent the programs were expanded.
Employment to Population Ratio of People without High School Degrees

Source: Bureau of Labor Statistics.
Employment to Population Ratio of People with High School Degrees
 Source: Bureau of Labor Statistics.
In short, Mulligan has an interesting story, but the data don’t seem to fit.
Addendum: The graph for those without high school degrees was corrected at 10:30. Thanks Barry.
Second Addendum: Since I’m beating up on Mulligan here, I want to give him credit for being right in his previous post. That one took Paul Krugman to task for arguing that anyone who believed that the release of the new version of the iPhone would increase GDP was a Keynesian. Mulligan gave a solidly grounded explanation whereby the new iPhone could simply be seen as the fruit that came from prior years’ investment. Of course Krugman is right that what is going on is a Keynesian boost to demand, but he is wrong that there is no possible non-Keynesian explanation for the iPhone providing a boost to growth.


Comments